Unlock a world of possibilities! Login now and discover the exclusive benefits awaiting you.
- Qlik Community
- :
- All Forums
- :
- QlikView App Dev
- :
- Re: Displaying data for certain groups
- Subscribe to RSS Feed
- Mark Topic as New
- Mark Topic as Read
- Float this Topic for Current User
- Bookmark
- Subscribe
- Mute
- Printer Friendly Page
- Mark as New
- Bookmark
- Subscribe
- Mute
- Subscribe to RSS Feed
- Permalink
- Report Inappropriate Content
Displaying data for certain groups
Hi all, I'm fairly new to Qlikview and learning my way around.
I'm looking to display the amount of time a certain group takes to process a request.
I have:
1.A create date
2.A create time
3.A complete date
4.A complete time
5.The difference between the end and start date using this formula:
LOAD *,Interval(([Complete Date]-[Create Date])+([Complete Time] - [Create Time]),'D hh:mm') as Diff;
Each create and completed date are associated with a certain group or approver.
I am looking to display all the requests and the average amount of time of each group/person associated with requests.
Also how much time on average that the entire list of people are taking with requests.
Can anyone give me any suggestions on expressions for charts to do this?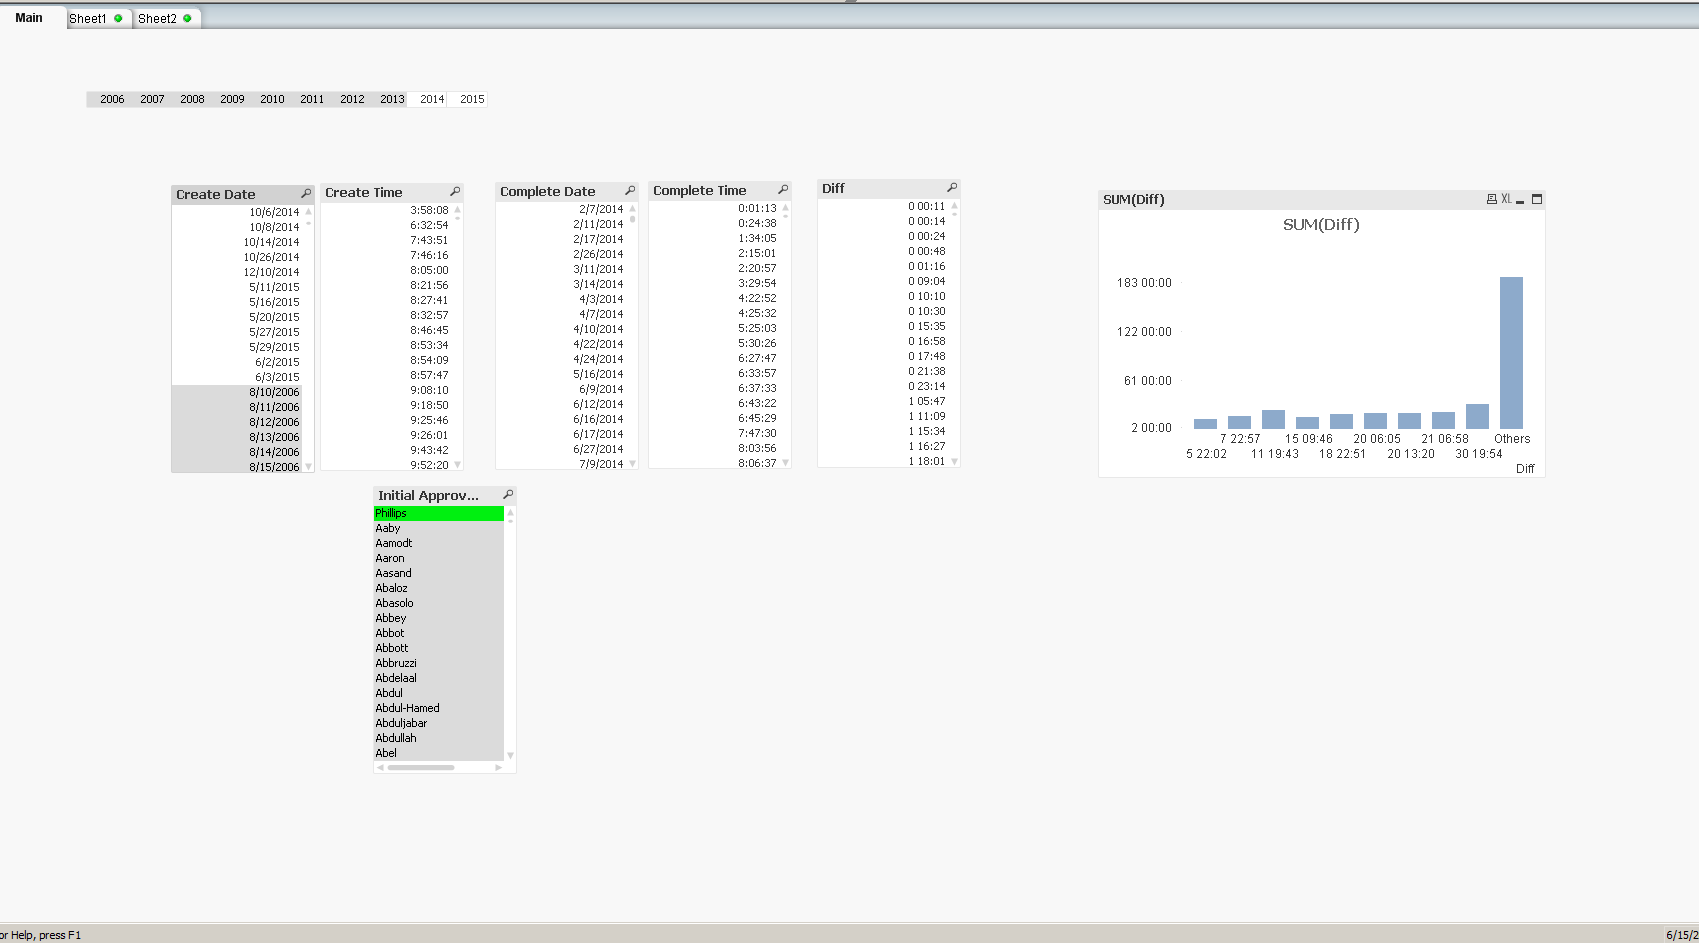
Accepted Solutions
- Mark as New
- Bookmark
- Subscribe
- Mute
- Subscribe to RSS Feed
- Permalink
- Report Inappropriate Content
clik on reply--on right side there USE ADVANCED EDITOR--clik on that--on bottom ATTACH--clik browse ur file---save.
- Mark as New
- Bookmark
- Subscribe
- Mute
- Subscribe to RSS Feed
- Permalink
- Report Inappropriate Content
please post sample data/app
thanks
regards
Marco
- Mark as New
- Bookmark
- Subscribe
- Mute
- Subscribe to RSS Feed
- Permalink
- Report Inappropriate Content
Hey Marco,
How do I post my QVW here or how can I share this data with you?
Thanks
- Mark as New
- Bookmark
- Subscribe
- Mute
- Subscribe to RSS Feed
- Permalink
- Report Inappropriate Content
clik on reply--on right side there USE ADVANCED EDITOR--clik on that--on bottom ATTACH--clik browse ur file---save.