Unlock a world of possibilities! Login now and discover the exclusive benefits awaiting you.
- Qlik Community
- :
- All Forums
- :
- QlikView App Dev
- :
- Trouble with ColorMix1() on Bar Chart Colors
Options
- Subscribe to RSS Feed
- Mark Topic as New
- Mark Topic as Read
- Float this Topic for Current User
- Bookmark
- Subscribe
- Mute
- Printer Friendly Page
Turn on suggestions
Auto-suggest helps you quickly narrow down your search results by suggesting possible matches as you type.
Showing results for
Not applicable
2015-06-16
07:13 PM
- Mark as New
- Bookmark
- Subscribe
- Mute
- Subscribe to RSS Feed
- Permalink
- Report Inappropriate Content
Trouble with ColorMix1() on Bar Chart Colors
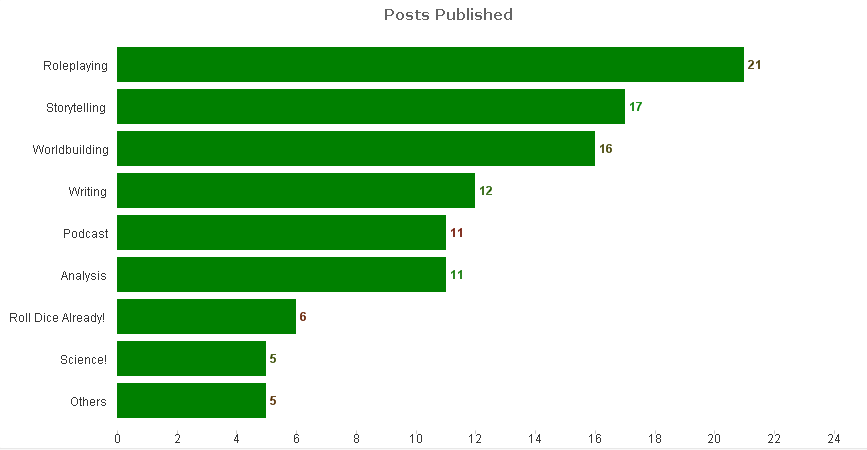
I'm trying to use a bar chart to show how blog posts per category were published, and what the relative views per post value is. From the Colormix Wizard and some tutorials I have the following expression set up.
ColorMix1 (
(Sum (#pageviews)/Count ({$<_published = {1}>} DISTINCT post_title))
/(RangeMax (top(total Sum (#pageviews)/Count ({$<_published = {1}>} DISTINCT post_title),1,NoOfRows(total))))
, Red(), Green())
I've used this on both the text color and the bar color. It is working perfect for the text color, but in the bar color a 1 is returned for all rows, making everything solid green. Any suggestions?
269 Views
0 Replies