Unlock a world of possibilities! Login now and discover the exclusive benefits awaiting you.
- Qlik Community
- :
- All Forums
- :
- QlikView App Dev
- :
- Re: Problem: Rolling 12-Month/current period with ...
- Subscribe to RSS Feed
- Mark Topic as New
- Mark Topic as Read
- Float this Topic for Current User
- Bookmark
- Subscribe
- Mute
- Printer Friendly Page
- Mark as New
- Bookmark
- Subscribe
- Mute
- Subscribe to RSS Feed
- Permalink
- Report Inappropriate Content
Problem: Rolling 12-Month/current period with fiscal year and number of customers with negative profit
Hello guys,
I have a problem within my application which I unfortunately cannot share. Hence I created a similar application to show you what I mean.
I would like to count all customers which have a negative profit over the last 12 month, e.g. last both month are positive but the last 12 month are totally negative then count. I would like to swap between current period, Rolling 6-Month, Rolling 12-Month too, e.g. the last 12 month of rolling 12 month are totally negative or last 12 month of current values are negative. The last point is that I would like to show the last 12 Month in a bar chart with the correct numbers.
I have two KPIs in my example data sets (profit and sales revenue). I used the AsOfTable-concept from Henric to get my rolling results. In my shared application you can find two charts: Sales revenue table and negative customer bar chart. The sales revenue table works very well but not my bar chart. If you open the application you see the rolling 12 month and if you click on current period you get the correct values for sales revenue but not for negative customers. If you click on a special date, e.g. jun 2015 you will get the correct values. So what is wrong?
Thank you very much in advance!
Best regards,
Sebastian
- « Previous Replies
-
- 1
- 2
- Next Replies »
- Mark as New
- Bookmark
- Subscribe
- Mute
- Subscribe to RSS Feed
- Permalink
- Report Inappropriate Content
Hi,
Your expression,
count(DISTINCT{<[Fiscal Date]={">=$(=MonthStart(Max([Fiscal Date]), -12))<=$(=MonthEnd(Max([Fiscal Date])))"}, [Customer ID]={"=sum([Profit])<0"}>} [Customer ID])
i think there is problem with {"=sum([Profit])<0"}, this gives sum of total profit value, not based on Customer ID.
Try the same with Aggregation, like
sum(Aggr(sum(Profit),[Customer ID],[Fiscal Month])) < 0.
See the Below screen shot for reference. for e.g Customer ID : DDD
Before Selecting the Fiscal Month,
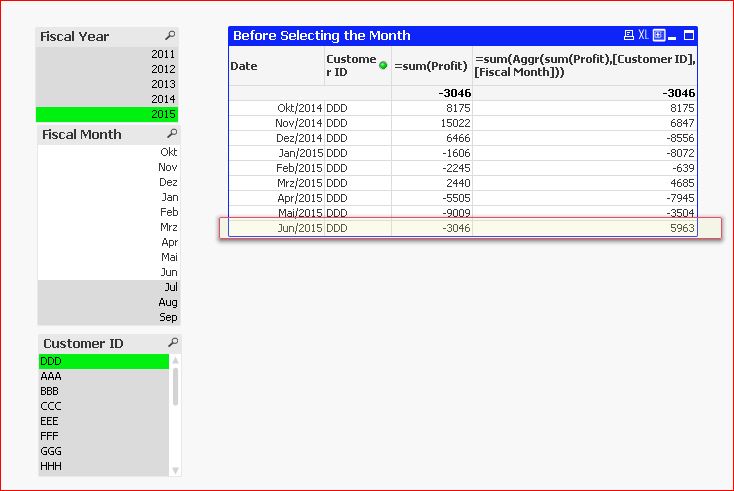
After Selecting the Fiscal Month
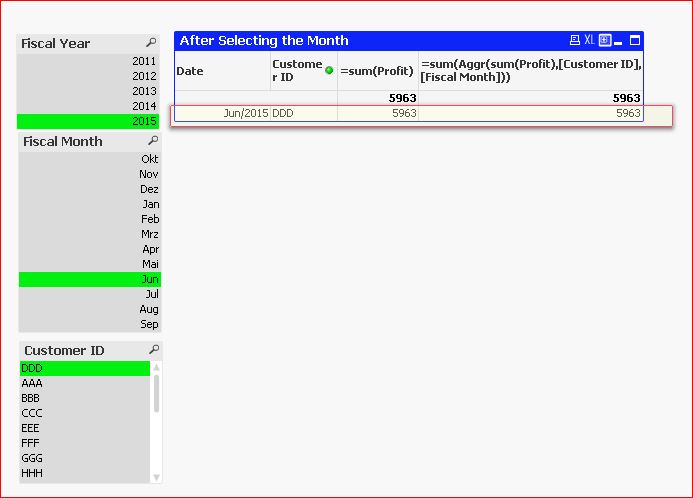
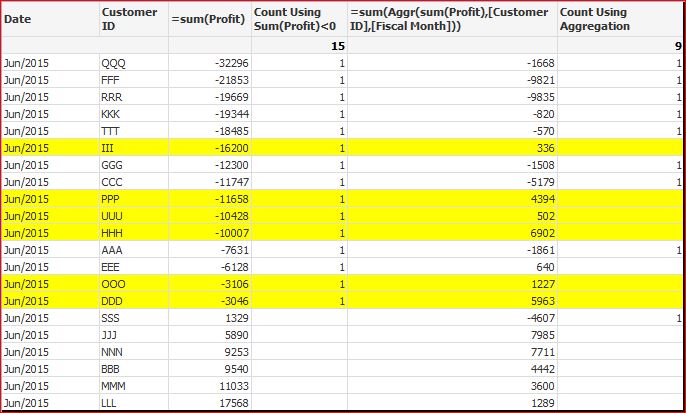
That is why you are getting the Correct result count as 9 for selecting the Month June. When you De-Select the Fiscal month, the sum(Profit) value goes negative, and it is also counted. see the below scree shot for
sum(Profit) vs Sum(aggregation(sum(Profit),[Customer ID],[Fiscal Month]) and their Count.
This may helpful for you.
- Mark as New
- Bookmark
- Subscribe
- Mute
- Subscribe to RSS Feed
- Permalink
- Report Inappropriate Content
Hi,
Thank you very much for your idea.
Unfortunately I get the same problem as in my own formula:
My formula:
count(DISTINCT{<[Fiscal Date]={">=$(=MonthStart(Max([Fiscal Date]), -12))<=$(=MonthEnd(Max([Fiscal Date])))"}, [Customer ID]={"=sum([Profit])<0"}>} [Customer ID])
Your suggestion:
count(DISTINCT{<[Fiscal Date]={">=$(=MonthStart(Max([Fiscal Date]), -12))<=$(=MonthEnd(Max([Fiscal Date])))"}, [Customer ID]={"=sum(Aggr(sum(Profit), [[Customer ID], [Fiscal Date]))<0"}>} [Customer ID])
(If doesn’t matter if I change [Fiscal Date] to [Fiscal Month] in Aggr part).
Both display the same result independent on my selection.
Bizarrely my sales revenue table is correct. Your argument is comprehensible, correct and very good, thanks a lot. There must be a problem with the count part. Do you have any more ideas?
Best,
Sebastian
- Mark as New
- Bookmark
- Subscribe
- Mute
- Subscribe to RSS Feed
- Permalink
- Report Inappropriate Content
Hi,
Try the below expression.
Count(Aggr(Count(DISTINCT{<Profit={'<0'},
[Fiscal Date]={">=$(=MonthStart(Max([Fiscal Date]), -12))<=$(=MonthEnd(Max([Fiscal Date])))"}>}
[Customer ID]),[Fiscal Month],[Fiscal Year],[Customer ID] ))
- Mark as New
- Bookmark
- Subscribe
- Mute
- Subscribe to RSS Feed
- Permalink
- Report Inappropriate Content
I get one value for everything with his formula e.g. Current period is the same as rolling 12 is the same as special month + year.
- Mark as New
- Bookmark
- Subscribe
- Mute
- Subscribe to RSS Feed
- Permalink
- Report Inappropriate Content
Try adding the set definition to the sum too:
count(DISTINCT{<[Fiscal Date]={">=$(=MonthStart(Max([Fiscal Date]), -12))<=$(=MonthEnd(Max([Fiscal Date])))"}, [Customer ID]={"=sum({<[Fiscal Date]={'>=$(=MonthStart(Max([Fiscal Date]), -12))<=$(=MonthEnd(Max([Fiscal Date])))'}>}[Profit])<0"}>} [Customer ID])
talk is cheap, supply exceeds demand
- Mark as New
- Bookmark
- Subscribe
- Mute
- Subscribe to RSS Feed
- Permalink
- Report Inappropriate Content
My values are now a little bit higher then before but unfortunately not correct
- Mark as New
- Bookmark
- Subscribe
- Mute
- Subscribe to RSS Feed
- Permalink
- Report Inappropriate Content
I added a separate straight table chart with [Fiscal Date] as dimension and two expressions:
1.) count({<Customer ID={"=sum(Profit)<0"}>} distinct [Customer ID])
2.) count({<Customer ID={"=aggr(sum(Profit), [Customer ID])<0"}>} distinct [Customer ID])
Both display the same result. If I select Current Period then I get a number which is not the same as if I select the single date in this table, e.g. Jun/2014 = X and if I click on Jun/2014 then I get Y and not X. I tried also a lot of alternatives constructions (e.g. count({<Customer ID={"=aggr(sum(Profit), [Customer ID], [Fiscal Date])<0"}>} distinct [Customer ID]) and so on) which aren´t helpful. So I think that the count-function doesn´t consider single months of the [Fiscal Date] dimension. I do not know how it is counting but it doesn´t use e.g. only Jun/2014. Aggr-function should be right but it isn´t. Perhaps you have some other ideas?
- Mark as New
- Bookmark
- Subscribe
- Mute
- Subscribe to RSS Feed
- Permalink
- Report Inappropriate Content
Hi.
In the attached document contains some comments, please analyze the data relationship between the tables is correct.
- Mark as New
- Bookmark
- Subscribe
- Mute
- Subscribe to RSS Feed
- Permalink
- Report Inappropriate Content
Hi,
Thanks for your feedback. I checked your Excel files and your application and you are at one point right. [Fiscal Date] is not correct but [Fiscal Date2]. The different between both are the months: Oct, Nov and Dec. Fiscal Date has Oct, Nov, Dec 2014 and Fiscal Date2 has Oct, Nov, Dec 2015, which is correct.
What you identifyis the principe of the AsOfTable-concept, that means e.g. if you click on Fiscal Year 2015 and month May then you will get May and Jun 2015 because of rolling 12-Month (Jun 2015 is the latest data set). So if you click on Oct 2015 you will get Oct, Nov, (...), until Jun 2015 in Fiscal Date2 and Period1 is your selection (Oct 2015). You could have a one-to-one relationship if you click on "Current Period" in Period1Type.
Nevertheless thank you very much 🙂
- « Previous Replies
-
- 1
- 2
- Next Replies »