Unlock a world of possibilities! Login now and discover the exclusive benefits awaiting you.
- Qlik Community
- :
- All Forums
- :
- QlikView App Dev
- :
- Re: How to display data dynamically?
- Subscribe to RSS Feed
- Mark Topic as New
- Mark Topic as Read
- Float this Topic for Current User
- Bookmark
- Subscribe
- Mute
- Printer Friendly Page
- Mark as New
- Bookmark
- Subscribe
- Mute
- Subscribe to RSS Feed
- Permalink
- Report Inappropriate Content
How to display data dynamically?
Hi,
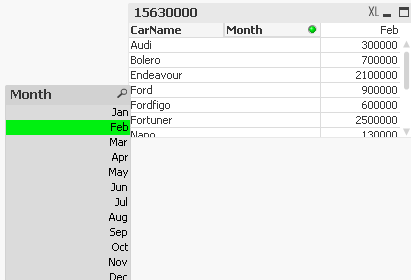
I create pivot table.and I want to display data dynamically but I do not
know how to display dynamically .pls tell me out how to display data dynamically in pivot table like this .If I select Jan in list box then pivot table show Jan data.If i select Feb in listbox then my Pivot table show jan and Feb Data.and If I select March In list box then My pivot table show Jan,Feb,March .
This is my data
LOAD Id,
CarName,
Price
FROM
(ooxml, embedded labels, table is Sheet1);
car:
LOAD
Month(Date#(RecNo(),'M')) as Month
AutoGenerate 12;
Here when I select Feb It dispaly only feb data but I want to display data like this when i select feb It dispaly Jan and feb data.If i select
Mar then pivot table display jan,feb,mar data.
Thankyou,
Regards
madhu
- Mark as New
- Bookmark
- Subscribe
- Mute
- Subscribe to RSS Feed
- Permalink
- Report Inappropriate Content
Hi,
Try the attachment. In the script just i added recno() for relating the tables.
and in the expression
=Sum({<Month={">=1<=$(=Max(Month))"}>}Price)
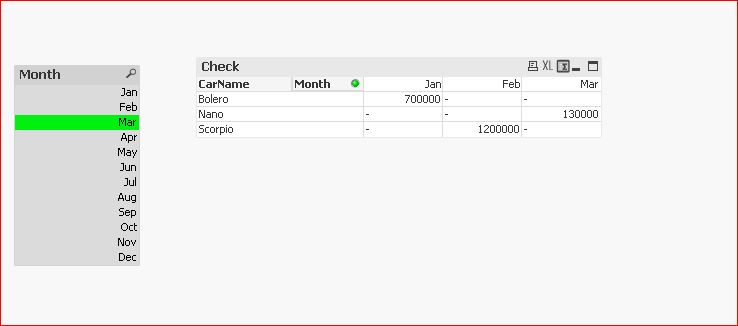
Hope this helps.
- Mark as New
- Bookmark
- Subscribe
- Mute
- Subscribe to RSS Feed
- Permalink
- Report Inappropriate Content
Thank you settu periasamy.but i can not open your document because I use qv Personal edition.pls can you keep script screen shot. pls
regards
madhu
- Mark as New
- Bookmark
- Subscribe
- Mute
- Subscribe to RSS Feed
- Permalink
- Report Inappropriate Content
Hi,
Here it is:
DIRECTORY;
LOAD Id,
  RecNo(),
     CarName,
     Price

FROM
Bundle1.xlsx
(ooxml, embedded labels, table is Sheet1);


LOAD
Month(Date#(RecNo(),'M')) as Month,
RecNo()
AutoGenerate 12;