Unlock a world of possibilities! Login now and discover the exclusive benefits awaiting you.
- Qlik Community
- :
- All Forums
- :
- QlikView App Dev
- :
- Re: Pareto analysis with classification. How filte...
- Subscribe to RSS Feed
- Mark Topic as New
- Mark Topic as Read
- Float this Topic for Current User
- Bookmark
- Subscribe
- Mute
- Printer Friendly Page
- Mark as New
- Bookmark
- Subscribe
- Mute
- Subscribe to RSS Feed
- Permalink
- Report Inappropriate Content
Pareto analysis with classification. How filter a single customer (whit correct classification)?
Hi All,
I created a Pareto analysis. It's correct.
But when I filter a BP (customer) the classification ('A', 'B', 'C') it's no longer correct (sales become 100% ).
How can I visualize the correct classification filtering a single BP?
Thanks
Daniele
- Tags:
- pareto analysis
- Mark as New
- Bookmark
- Subscribe
- Mute
- Subscribe to RSS Feed
- Permalink
- Report Inappropriate Content
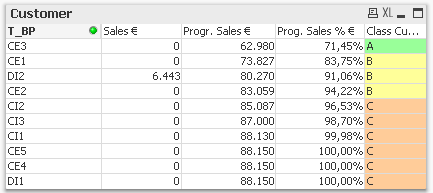
You need to replace Sum(T_Ordinato) with Sum({1} T_Ordinato) in a number of places, including the sort expression. In the picture below, I have done so in all places except the first expression. This way you can see the selection there.
HIC
- Mark as New
- Bookmark
- Subscribe
- Mute
- Subscribe to RSS Feed
- Permalink
- Report Inappropriate Content
Hi,
Check this expression for Prog. Sales % €
RangeSum(Above(Sum(T_Ordinato), 0, RowNo())) / Sum({<T_BP=>} total T_Ordinato)
Regards,
Jagan.
- Mark as New
- Bookmark
- Subscribe
- Mute
- Subscribe to RSS Feed
- Permalink
- Report Inappropriate Content
Hi,
with this expression, the classification "A" it's not correct for DI2 customer. It should be "B".
For Henric: I would only 1 row (this report will send to BP)
Thanks
- Mark as New
- Bookmark
- Subscribe
- Mute
- Subscribe to RSS Feed
- Permalink
- Report Inappropriate Content
If you want the classification to be static, you should probably do the above calculations already in the script. I.e. you need to create a table with the total sales number, grouped by customer, sort it according to sales, and assign the classification. Then you will have the classification static and in a field of its own.
HIC
- Mark as New
- Bookmark
- Subscribe
- Mute
- Subscribe to RSS Feed
- Permalink
- Report Inappropriate Content
Hi,
If you want to retain the same values then you have to calculate this in script.
Regards,
Jagan.
- Mark as New
- Bookmark
- Subscribe
- Mute
- Subscribe to RSS Feed
- Permalink
- Report Inappropriate Content
Hi Henric and Jagan,
the problem is that this classification is dynamically determined (for Company,Year, to Month...) during analysis
I can't do this in script.
Perhaps the problem has no solution...
Even Qlik has limits ... 
Regards
Daniele
- Mark as New
- Bookmark
- Subscribe
- Mute
- Subscribe to RSS Feed
- Permalink
- Report Inappropriate Content
Yes,
Actually in this scenario, your calculations are being calculated on the fly, functions like rowno() and Above are chart level functions and when you make selection, these functions again change the values according to your selection,thus you get results on the fly, this is the good part of Qlik 🙂
- Mark as New
- Bookmark
- Subscribe
- Mute
- Subscribe to RSS Feed
- Permalink
- Report Inappropriate Content
An optional way to do this is to use an ABC-categorization based on rank rather than Pareto. Then you can define a calculated dimension where you explicitly disregard a selection in the Customer field.
Aggr( If((Rank(Sum({$<Customer=>} Sales),1)-1) / Count({$<Customer=>} distinct total Customer)< 0.50, 'A',
If((Rank(Sum({$<Customer=>} Sales),1)-1) / Count({$<Customer=>} distinct total Customer)< 0.75, 'B', 'C')),
Customer)
See more on Recipe for an ABC Analysis
HIC