Unlock a world of possibilities! Login now and discover the exclusive benefits awaiting you.
- Qlik Community
- :
- All Forums
- :
- Qlik NPrinting
- :
- Nprinting chart transparency
- Subscribe to RSS Feed
- Mark Topic as New
- Mark Topic as Read
- Float this Topic for Current User
- Bookmark
- Subscribe
- Mute
- Printer Friendly Page
- Mark as New
- Bookmark
- Subscribe
- Mute
- Subscribe to RSS Feed
- Permalink
- Report Inappropriate Content
Nprinting chart transparency
Hi
I'm really stuck I have a bar chart which is a stacked type, In order to show totals as scatter I've needed to make it an overlay with transparency to a scatter chart underneath.
I'm trying to create a powerpoint presentation with the chart but it is loosing its transparency, so I can see the bar chart but not the scatter points underneath. Anyone had this problem before as I'm on the verge of throwing my computer out of the window 
Thanks
Sarah
- Mark as New
- Bookmark
- Subscribe
- Mute
- Subscribe to RSS Feed
- Permalink
- Report Inappropriate Content
Hi Sarah,
I assume you are bringing in your charts as images. If so, you are experiencing expected behavior. You can test this without involving NPrinting at all. Simply export your chart and save it as a PNG image directly from your QlikView document. Use this image in a PowerPoint slide and try to manipulate it's background transparency. In my tests I was not able to make any changes. NPrinting uses the QlikView API to export charts as images so you can expect the same behavior.
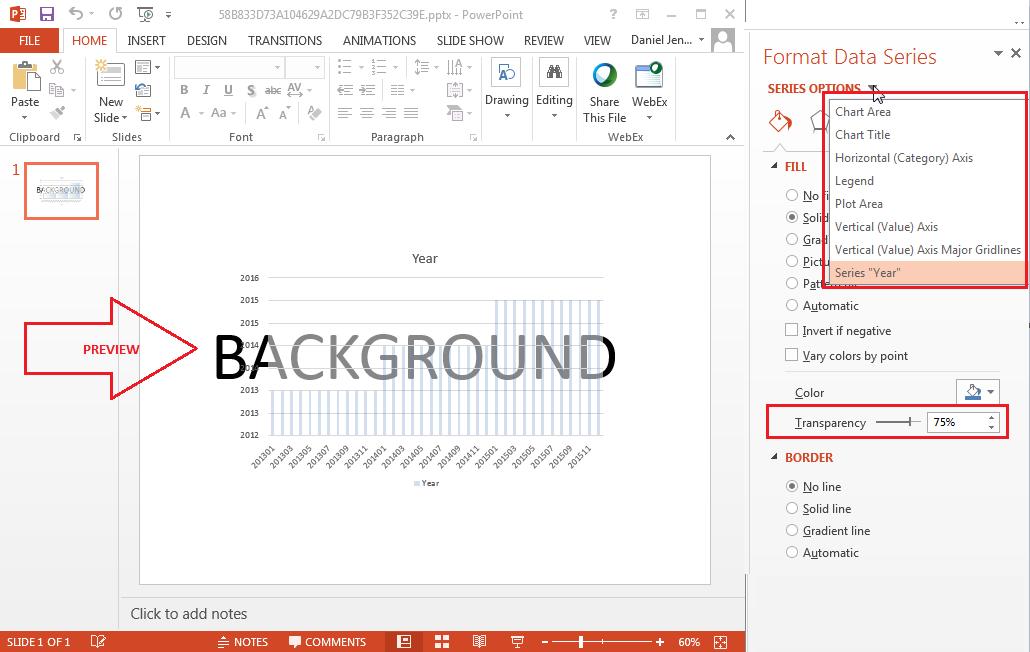
Have you tried creating PowerPoint charts using native QlikView tables instead? You have more control over transparency this way.
HTH - Daniel.
- Mark as New
- Bookmark
- Subscribe
- Mute
- Subscribe to RSS Feed
- Permalink
- Report Inappropriate Content
Hi Daniel,
thanks for your help, unfortunately Im stuck with using n printing  is there a work around ?
- Mark as New
- Bookmark
- Subscribe
- Mute
- Subscribe to RSS Feed
- Permalink
- Report Inappropriate Content
Hi Sarah,
Not sure I understand. I did propose a QlikView NPrinting alternative
- Daniel.