Unlock a world of possibilities! Login now and discover the exclusive benefits awaiting you.
- Qlik Community
- :
- All Forums
- :
- QlikView App Dev
- :
- Re: Line chart - dots only, hide lines
- Subscribe to RSS Feed
- Mark Topic as New
- Mark Topic as Read
- Float this Topic for Current User
- Bookmark
- Subscribe
- Mute
- Printer Friendly Page
- Mark as New
- Bookmark
- Subscribe
- Mute
- Subscribe to RSS Feed
- Permalink
- Report Inappropriate Content
Line chart - dots only, hide lines
Hi,
I need to show dots only, no lines. Any ideas?

- « Previous Replies
-
- 1
- 2
- Next Replies »
- Mark as New
- Bookmark
- Subscribe
- Mute
- Subscribe to RSS Feed
- Permalink
- Report Inappropriate Content
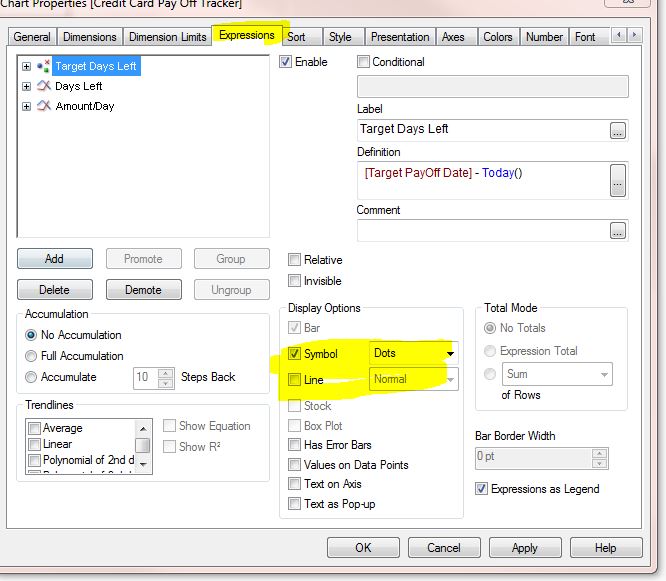
Hi, This option is available on the Expression tab of the Chart Properties.
Goto Chart Properties --> Expressions --> In the middle there loat of options. Un check the Line & Check the Symbol & Select Dots
- Mark as New
- Bookmark
- Subscribe
- Mute
- Subscribe to RSS Feed
- Permalink
- Report Inappropriate Content
see tis,
- Mark as New
- Bookmark
- Subscribe
- Mute
- Subscribe to RSS Feed
- Permalink
- Report Inappropriate Content
It works!
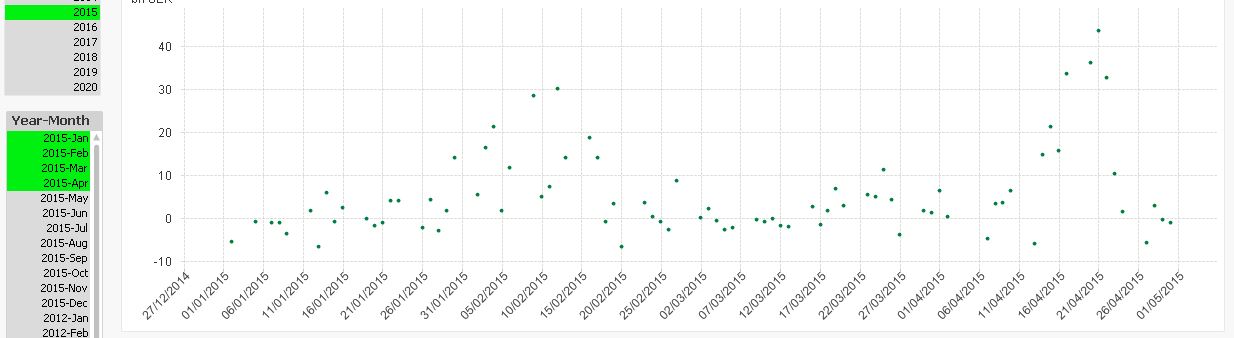
However is there a way to force the graph to always show dots?
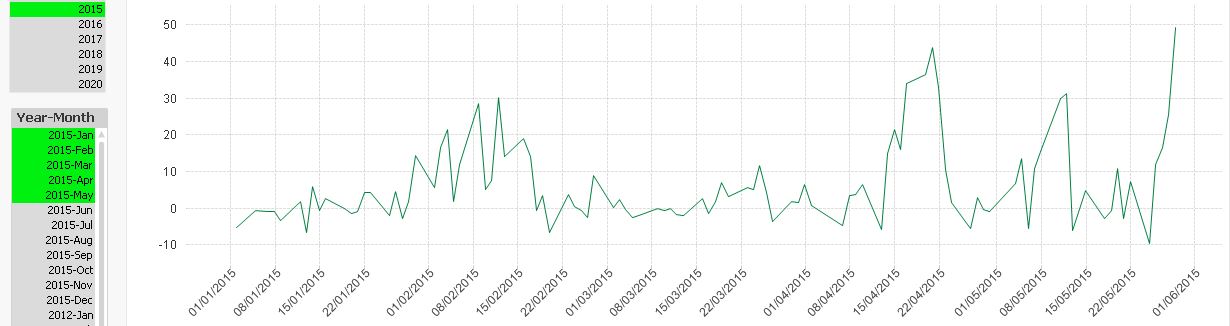
When the observations are many the chart shows a line instead of dots.
When choosing Jan to Apr
Choosing jan to may
- Mark as New
- Bookmark
- Subscribe
- Mute
- Subscribe to RSS Feed
- Permalink
- Report Inappropriate Content
by unchecking tht line check box it won't show the line,what i believe!
- Mark as New
- Bookmark
- Subscribe
- Mute
- Subscribe to RSS Feed
- Permalink
- Report Inappropriate Content
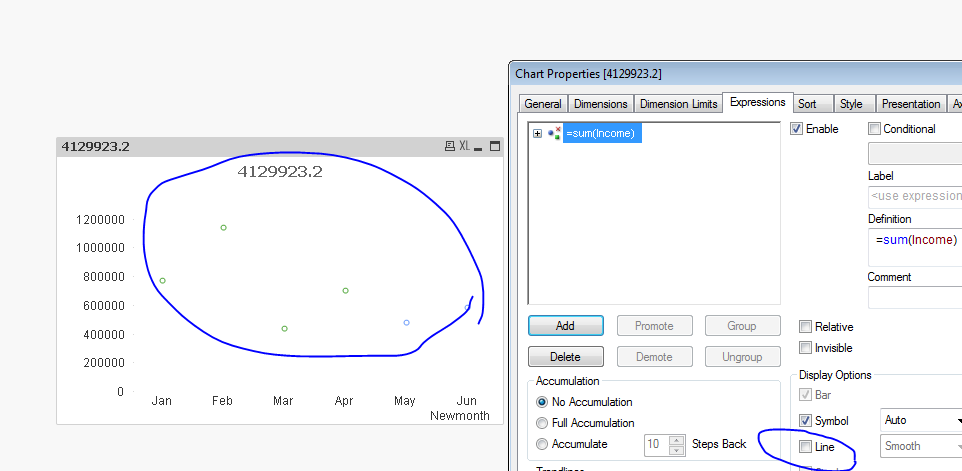
This Chart specific option. If you have multiple charts, you need turn this option to other chart as well.
- Mark as New
- Bookmark
- Subscribe
- Mute
- Subscribe to RSS Feed
- Permalink
- Report Inappropriate Content
Hmm interesting, where do I change it?
- Mark as New
- Bookmark
- Subscribe
- Mute
- Subscribe to RSS Feed
- Permalink
- Report Inappropriate Content
Hi Shiva,
this is what it looks like. Still shows a line if the observations are many enough
Regards,
Olle 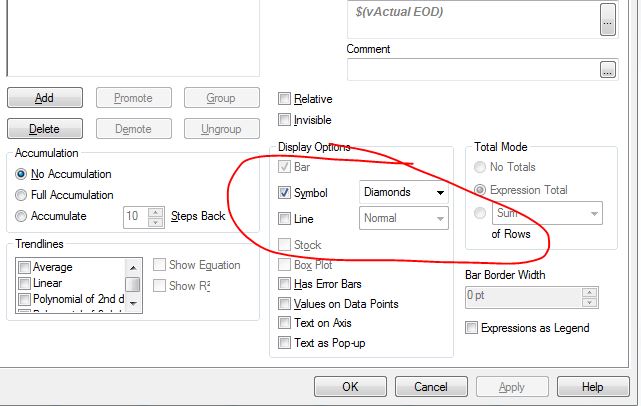
- Mark as New
- Bookmark
- Subscribe
- Mute
- Subscribe to RSS Feed
- Permalink
- Report Inappropriate Content
is't possible to share ur app with less data?,then we will try to help here.
- Mark as New
- Bookmark
- Subscribe
- Mute
- Subscribe to RSS Feed
- Permalink
- Report Inappropriate Content
It will show a line if there are more than a certain number of data points regardless of these settings. I am not aware if a simple workaround exists.
- « Previous Replies
-
- 1
- 2
- Next Replies »