Unlock a world of possibilities! Login now and discover the exclusive benefits awaiting you.
- Qlik Community
- :
- Forums
- :
- Analytics
- :
- New to Qlik Analytics
- :
- Re: Combo or Line Chart with More Than 15 Measures...
- Subscribe to RSS Feed
- Mark Topic as New
- Mark Topic as Read
- Float this Topic for Current User
- Bookmark
- Subscribe
- Mute
- Printer Friendly Page
- Mark as New
- Bookmark
- Subscribe
- Mute
- Subscribe to RSS Feed
- Permalink
- Report Inappropriate Content
Combo or Line Chart with More Than 15 Measures.
Hi All,
I would like to ask you how to show measures in QSense if i have 20 measures (20 GROUP_CLASS),
and i will show it in one line chart or combo chart. and I use filter GROUP_CLASS,
if I unselect all, then it would appear all line.
and if I select some GROUP_CLASS, then only a few line of GROUP_CLASS that will appear.
i use expression => sum(distinct If([GROUP_CLASS] = 'G1' ,sales)).
is there someone have this experience use other extension or have a better solution?
Regards,
Ted
- Tags:
- line chart
- Mark as New
- Bookmark
- Subscribe
- Mute
- Subscribe to RSS Feed
- Permalink
- Report Inappropriate Content
is there any reason not to add GROUP_CLASS as dimension and sum (sales) as expression?
Additionally you can add GROUP_CLASS as listbox/filter in the UI to filter the data.
- Mark as New
- Bookmark
- Subscribe
- Mute
- Subscribe to RSS Feed
- Permalink
- Report Inappropriate Content
Hi Phaneendra,
i have added GROUP_CLASS in filter, i wanna show sales by group_class by yearmonth.
- Mark as New
- Bookmark
- Subscribe
- Mute
- Subscribe to RSS Feed
- Permalink
- Report Inappropriate Content
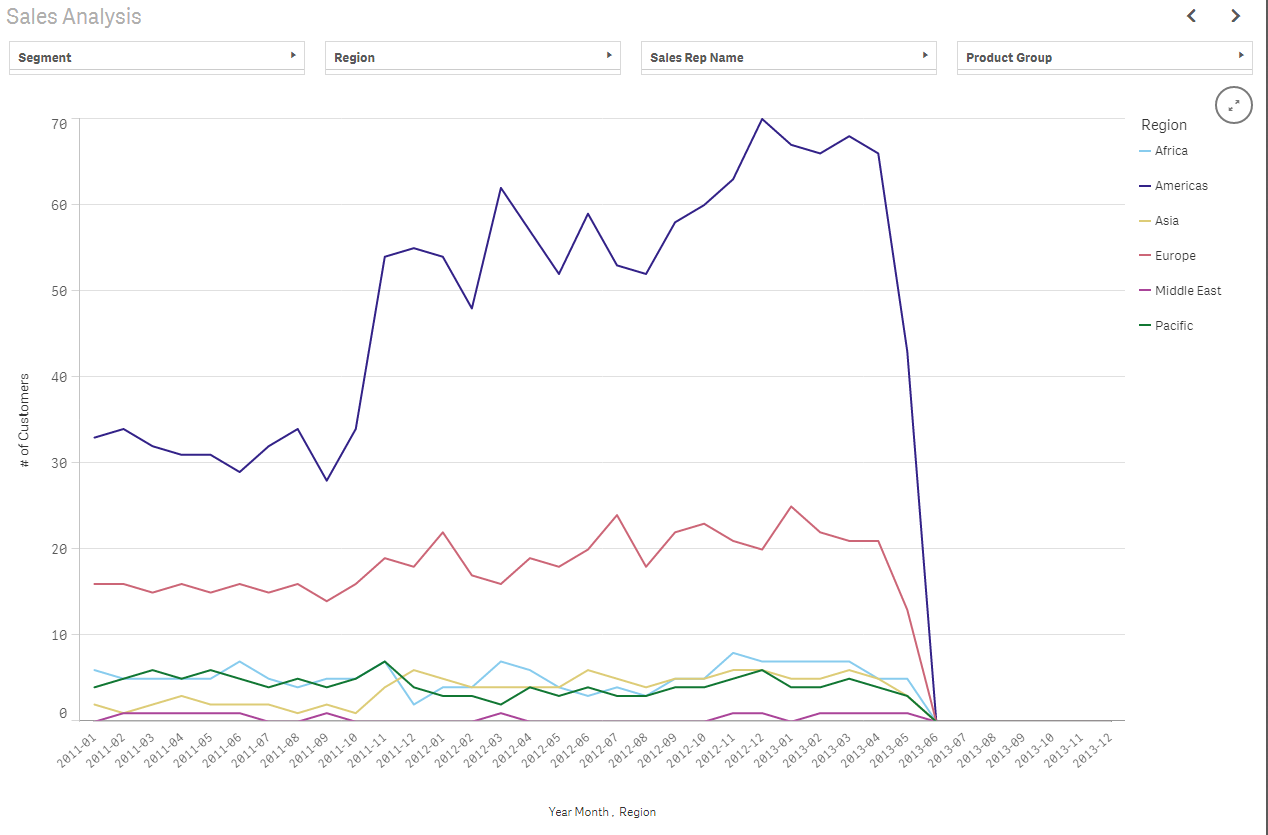
Some thing like this?
- Mark as New
- Bookmark
- Subscribe
- Mute
- Subscribe to RSS Feed
- Permalink
- Report Inappropriate Content
I enclose screenshoot below: 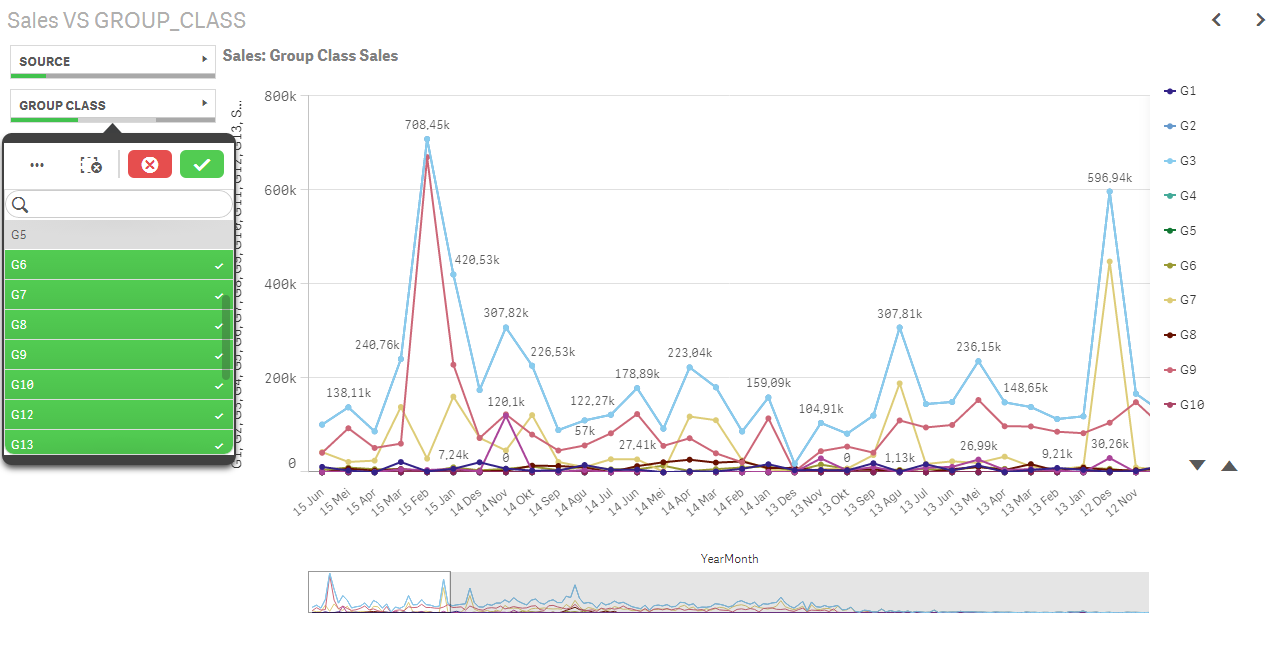
- Mark as New
- Bookmark
- Subscribe
- Mute
- Subscribe to RSS Feed
- Permalink
- Report Inappropriate Content
I don't see a reason why u can not use Time and Group Class as dimensions and sum(sales) as expression in line chart.
What made you to write individual expressions for each group class?