Unlock a world of possibilities! Login now and discover the exclusive benefits awaiting you.
- Qlik Community
- :
- All Forums
- :
- QlikView App Dev
- :
- Re: Showing dollar sign as well as decimals on a c...
- Subscribe to RSS Feed
- Mark Topic as New
- Mark Topic as Read
- Float this Topic for Current User
- Bookmark
- Subscribe
- Mute
- Printer Friendly Page
- Mark as New
- Bookmark
- Subscribe
- Mute
- Subscribe to RSS Feed
- Permalink
- Report Inappropriate Content
Showing dollar sign as well as decimals on a chart
Hi,
after using dollar sign in number tab and fixing decimals as well as fixing axis i am getting dollar sign as well as point values
on both mouse over values as well as on y axis
As per requirement i need to show dollar sign after each step on y axis and should not have any decimals
but on mouse over value should be up to 2 decimals and should not have dollar
sign.
I have also attached sample file for the same
Can you please suggest shall i go ahead
- « Previous Replies
-
- 1
- 2
- Next Replies »
- Mark as New
- Bookmark
- Subscribe
- Mute
- Subscribe to RSS Feed
- Permalink
- Report Inappropriate Content
Hi Sunny,
i need to plot line chart also in this manner.But in line chart it is showing values for both expression .
Thanks
- Mark as New
- Bookmark
- Subscribe
- Mute
- Subscribe to RSS Feed
- Permalink
- Report Inappropriate Content
So here is what the issue is. On a bar chart also there is a point (since it a symbol expression) where you would see same two value with different formatting: (in this case if you put your cursor in the middle of the bottom bar, the blue one, you will see them both)
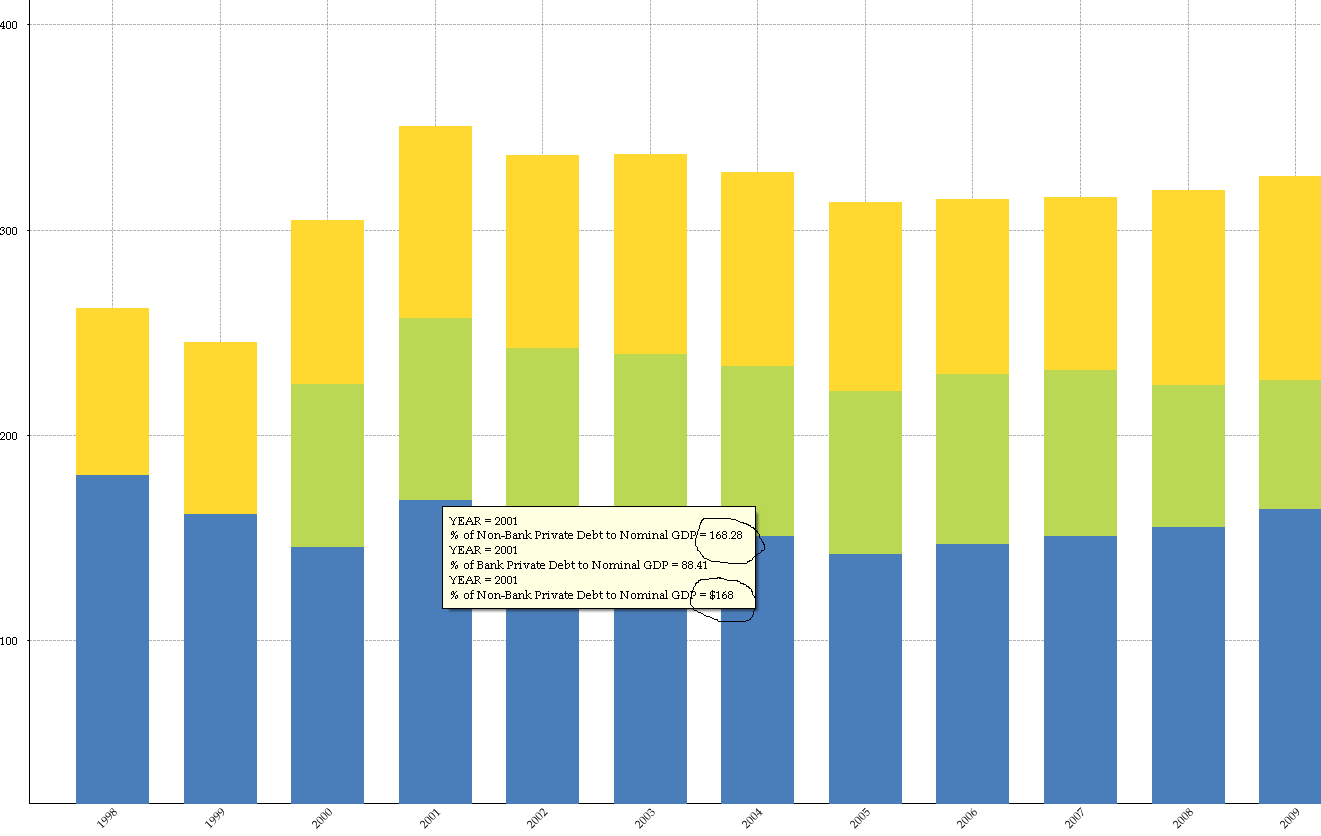
but the odds of putting your cursor at that one place are low.
But with a line chart, line and symbol can only show value where the coincide at the same spot and any time you want to see there value, you will see both all the time. The workaround is to change the invisible symbol expression to an invisible bar expression, which seems to do the trick.


I hope this will help explain why you were seeing two things and we also have a work around to make it to work.
Best,
Sunny
- Mark as New
- Bookmark
- Subscribe
- Mute
- Subscribe to RSS Feed
- Permalink
- Report Inappropriate Content
Thanks Sunny 
- « Previous Replies
-
- 1
- 2
- Next Replies »