Unlock a world of possibilities! Login now and discover the exclusive benefits awaiting you.
- Qlik Community
- :
- All Forums
- :
- QlikView App Dev
- :
- Re: expression as variable
- Subscribe to RSS Feed
- Mark Topic as New
- Mark Topic as Read
- Float this Topic for Current User
- Bookmark
- Subscribe
- Mute
- Printer Friendly Page
- Mark as New
- Bookmark
- Subscribe
- Mute
- Subscribe to RSS Feed
- Permalink
- Report Inappropriate Content
expression as variable
Hello Community,
these are my tables which I load in my script
MAP_PV:
Mapping LOAD
Category,
avg_PV_for_Category
FROM
[B-Basisdaten.xlsx]
(ooxml, embedded labels, table is Kategorien);
MAP_Zins:
Mapping LOAD
Periode,
Zins
FROM
[B-Basisdaten.xlsx]
(ooxml, embedded labels, table is Zinsdaten);
Data:
LOAD *,
([Payment (Asset) p. m.]/[Selling price])*100 as Leasingfaktor, //created field Leasingfaktor
Applymap('MAP_PV', Category) as avg_PV_for_Category,
Applymap('MAP_Zins',[Lease start date]) as Zins;
Directory;
LOAD [Lease No] as Kaufschein,
Position,
Subposition,
Manufacturer as Hersteller,
[Serial Number],
Category,
Model as Anlagebezeichnung,
[Lease start date],
[Scheduled lease end date],
[Actual lease end],
[Cost centre (asset)] as Kostenstelle,
[Location of installation] as Standort,
[Selling price],
[Payment (Asset) p. m.],
Currency,
Leasinggeber as Region,
Technologie as Kategorie
FROM
[A-Import_LPM.xlsx]
(ooxml, embedded labels, table is Sheet1)
where [Payment (Asset) p. m.]>0;
let vAuswertungsdatum = today();
Join (Data)
LOAD *,
If(AvgLeasingfaktor>=1.5 and AvgLeasingfaktor < 2.0, '60 Monate',
If(AvgLeasingfaktor>=2.0 and AvgLeasingfaktor < 2.4, '48 Monate',
If(AvgLeasingfaktor >=2.4, '36 Monate','Festkontraktierte Verlängerung')))as Zuordnung;
LOAD Category,
Zins,
Avg(Leasingfaktor) as AvgLeasingfaktor
Resident Data
Group By Category,Zins;
What I actually want to do is to operate serveral results of an expression. For example:
If I have two different charts with different results
sum([Selling price]) = 1000 = I call the expression "Investment" -> 1. Chart
avg_PV_for_Category*sum([Selling price]) = 10000 = I call the expression "PV Kosten" -> 2. Chart
What I'd like to do is
Investment+PVKosten=11000
I know that I have to define those expression as variables.
So I have to go to: Settings/Variables
I put in the field "Value" sum([Selling price]) and give it the name "vInvestment"
analog avg_PV_Category*sum([Selling price]) and give it the name "vPVKosten"
Now I create a straight table and want to operate (sum,multiply, substract etc). But I dont really know the syntax of how to put them in an expression.
Nothing happens if i just add the expression vInvestment+vPVKosten
It returns me nothing.
So my questions are:
is the syntax correct if I define a new variable or do I have to add a "=" before the expression in the Valuefield?
-> =sum([Selling price]) -> vInvestment
what is the syntax to operate different expressions which are defined as variables?
-> vInvestment+vPVKosten ? (definetly this is the wrong syntax)
And is it possible to use variables in variables?
example.
I defined my variable sum([Selling price]) as vInvestment
I'd like to redefine my variable vPVKosten to avg_PV_Category*vInvestment
here I used my variable which I defined before.
I m a beginner in QV it would be great if you exlpain or give me solutions as comprehensive as possible.
- Tags:
- qlikview_scripting
- « Previous Replies
-
- 1
- 2
- Next Replies »
- Mark as New
- Bookmark
- Subscribe
- Mute
- Subscribe to RSS Feed
- Permalink
- Report Inappropriate Content
There are way too many dependencies for my liking... You just need to go through your formulas and find the errors. I have started in the attached app.
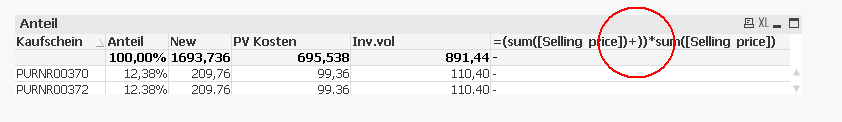
A suggestion: Don't put labels on the expressions until they work. In the image below, you can see that there is an error in the 5th expression - so you need to fix that variable.
HIC
- Mark as New
- Bookmark
- Subscribe
- Mute
- Subscribe to RSS Feed
- Permalink
- Report Inappropriate Content
I cant open the png file. it says that i dont have the permission
- Mark as New
- Bookmark
- Subscribe
- Mute
- Subscribe to RSS Feed
- Permalink
- Report Inappropriate Content
Try the attached qvw file
- Mark as New
- Bookmark
- Subscribe
- Mute
- Subscribe to RSS Feed
- Permalink
- Report Inappropriate Content
thank you very much for your help. I gonna check this out on monday. I m currently not in the office.
- « Previous Replies
-
- 1
- 2
- Next Replies »