Unlock a world of possibilities! Login now and discover the exclusive benefits awaiting you.
- Qlik Community
- :
- All Forums
- :
- QlikView App Dev
- :
- Re: forcast
- Subscribe to RSS Feed
- Mark Topic as New
- Mark Topic as Read
- Float this Topic for Current User
- Bookmark
- Subscribe
- Mute
- Printer Friendly Page
- Mark as New
- Bookmark
- Subscribe
- Mute
- Subscribe to RSS Feed
- Permalink
- Report Inappropriate Content
forcast
Hello all,
I have a problem with my qv document. For some kind of forcast i need to get values from precious months. I want to calculate the next month via an evarage from the previous 12 months. But the problem is that i cant grab a count() value before januari becouse for some reason my QV document isn't seeing December above januari.
I've added an example in which i can't get a value fromd december in the month januari.
Can anybody help me with this?
Thanks in advance!!
- Mark as New
- Bookmark
- Subscribe
- Mute
- Subscribe to RSS Feed
- Permalink
- Report Inappropriate Content
Above() is considering column segments, you need to use the TOTAL qualifier to get what you want:
=above(TOTAL count(TaskID),1)
- Mark as New
- Bookmark
- Subscribe
- Mute
- Subscribe to RSS Feed
- Permalink
- Report Inappropriate Content
Since you're using more than one dimension in your chart you need to add the total keyword to the above function so it will be able to cross the dimension borders: above(total count(TaskID),1)
As an aside... the above function can only work with data that is in the chart context. If for example you select 2014 then your expression can't get at the values in 2013. This document can show you how to get around that issue: Calculating rolling n-period totals, averages or other aggregations
talk is cheap, supply exceeds demand
- Mark as New
- Bookmark
- Subscribe
- Mute
- Subscribe to RSS Feed
- Permalink
- Report Inappropriate Content
Thank you very much! This helps. Although i still keep left with one problem with which you could help me.
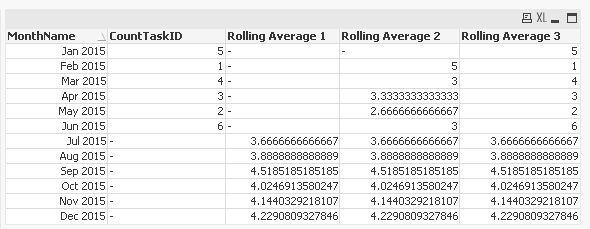
My customer wants to see a rolling avarage (as he calls it) into the future.
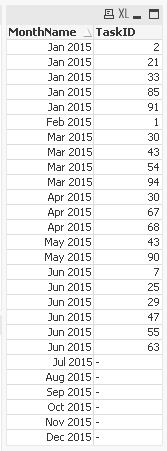
For example if we take the table from the file i added:
| Year | month | count(TaskID) | Rolling avarage |
| 2013 | dec | 3 | - |
| 2014 | jan | 6 | - |
| 2014 | feb | 6 | - |
| 2014 | mrt | - | =((3+6+6)/3)=5 |
| 2014 | apr | - | =((6+6+5)/3)=5.67 |
| 2014 | may | - | =((6+5+5.67)/3)=5.56 |
As you see the customer wants that when there aren't any TaskID values the Rolling avarage of the last periode is taken. In this way he can "predict" future task capacity.
I hope this is posible. Thanks in advance!
- Mark as New
- Bookmark
- Subscribe
- Mute
- Subscribe to RSS Feed
- Permalink
- Report Inappropriate Content
That's a tricky one. I've come up with something that looks like it will work in certain situations. See attached qvw. Adding additional dimensions will play havoc with it. And so can selections.
talk is cheap, supply exceeds demand
- Mark as New
- Bookmark
- Subscribe
- Mute
- Subscribe to RSS Feed
- Permalink
- Report Inappropriate Content
Hi,
another solution as well as some alternative "rolling average" definitions could be also:
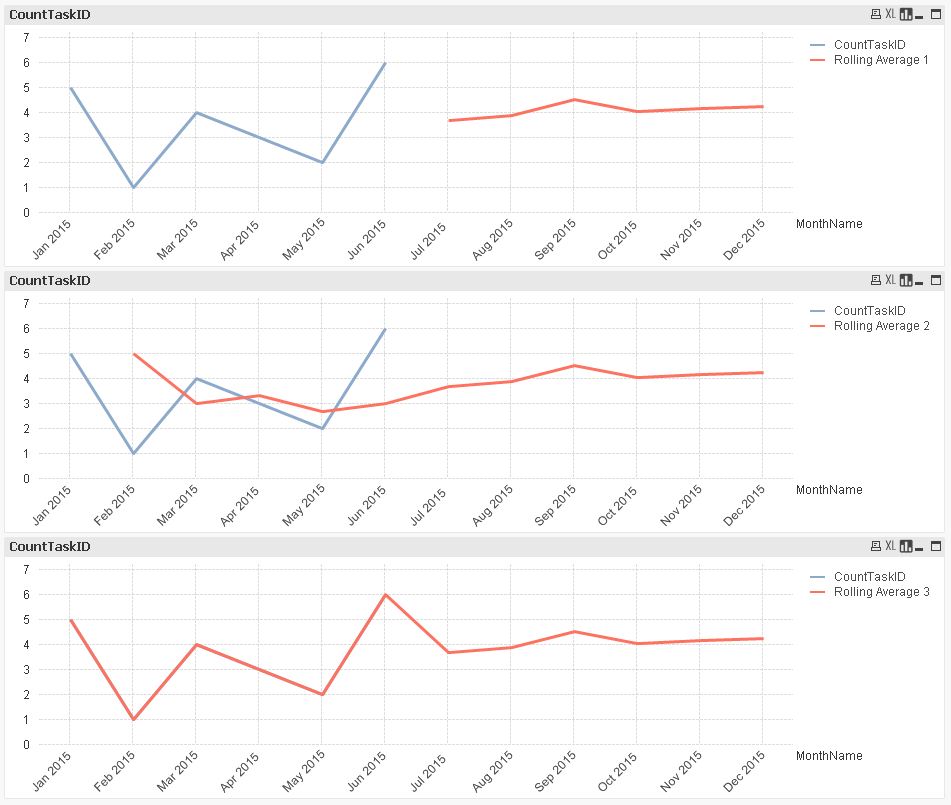
hope this helps
regards
Marco
- Mark as New
- Bookmark
- Subscribe
- Mute
- Subscribe to RSS Feed
- Permalink
- Report Inappropriate Content
any luck testing the proposed solutions so far?
thanks
regards
Marco
- Mark as New
- Bookmark
- Subscribe
- Mute
- Subscribe to RSS Feed
- Permalink
- Report Inappropriate Content
Hello Marco,
Sorry for the late reaction. But i'm still working things out. It isn't working properly but all the help gave me a good nodge in the richt direction.
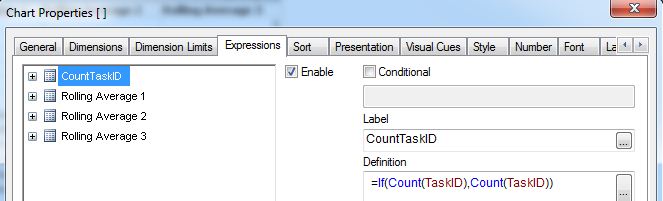
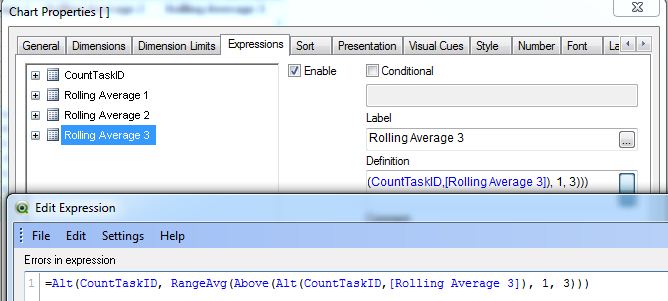
The only thing i need to fix now (i thing) is how to use a calculated label in an expression.
I can already use a label in an expression bur my problem is what if the label is "=count(TaskID)" how can i use that in my expression?
- Mark as New
- Bookmark
- Subscribe
- Mute
- Subscribe to RSS Feed
- Permalink
- Report Inappropriate Content
Hi,
you can reference to other columns within a chart not only by column name (expression label) but also using the Column() function (see help).
hope this helps
regards
Marco