Unlock a world of possibilities! Login now and discover the exclusive benefits awaiting you.
- Qlik Community
- :
- All Forums
- :
- QlikView App Dev
- :
- crosstable with indicators in line
- Subscribe to RSS Feed
- Mark Topic as New
- Mark Topic as Read
- Float this Topic for Current User
- Bookmark
- Subscribe
- Mute
- Printer Friendly Page
- Mark as New
- Bookmark
- Subscribe
- Mute
- Subscribe to RSS Feed
- Permalink
- Report Inappropriate Content
crosstable with indicators in line
hello
i want to have a table with indicator in line like this :
Indicator \ Year 2015 2014
CA 20 52
VOL 20 55
QTY 10 10
Can you tell me how to do it pls.
Thks in advance
- Mark as New
- Bookmark
- Subscribe
- Mute
- Subscribe to RSS Feed
- Permalink
- Report Inappropriate Content
You want it like this?
Indicator Year Value
CA 2015 20
CA 2014 52
VOL 2015 20
VOL 2014 55
QTY 2015 10
QTY 2014 10
- Mark as New
- Bookmark
- Subscribe
- Mute
- Subscribe to RSS Feed
- Permalink
- Report Inappropriate Content
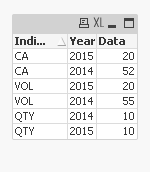
If yes, then try the following script:
Table:
LOAD * Inline [
Indicator, 2015, 2014
CA, 20, 52
VOL, 20, 55
QTY, 10, 10
];
NewTable:
CrossTable (Year, Data, 1)
LOAD *
Resident Table;
DROP Table Table;
Output:
- Mark as New
- Bookmark
- Subscribe
- Mute
- Subscribe to RSS Feed
- Permalink
- Report Inappropriate Content
I want it like this
Indicator \ Year 2015 2014
CA 20 52
VOL 20 55
QTY 10 10
but if i have this one i'll do what i want
Indicator Year Value
CA 2015 20
CA 2014 52
VOL 2015 20
VOL 2014 55
QTY 2015 10
QTY 2014 10
- Mark as New
- Bookmark
- Subscribe
- Mute
- Subscribe to RSS Feed
- Permalink
- Report Inappropriate Content
I am unsure of how your data is right now and how you want it to look like. Can you share an example of what your data looks like?
Best,
Sunny
- Mark as New
- Bookmark
- Subscribe
- Mute
- Subscribe to RSS Feed
- Permalink
- Report Inappropriate Content
The data comes from a database not from a file, i have a dimension named Time, Product, Saler and the fact table Sales.
- Mark as New
- Bookmark
- Subscribe
- Mute
- Subscribe to RSS Feed
- Permalink
- Report Inappropriate Content
Your data looks like this?
Indicator \ Year 2015 2014
CA 20 52
VOL 20 55
QTY 10 10
or this?
Indicator Year Value
CA 2015 20
CA 2014 52
VOL 2015 20
VOL 2014 55
QTY 2015 10
QTY 2014 10
This is what is confusing me right now.
- Mark as New
- Bookmark
- Subscribe
- Mute
- Subscribe to RSS Feed
- Permalink
- Report Inappropriate Content
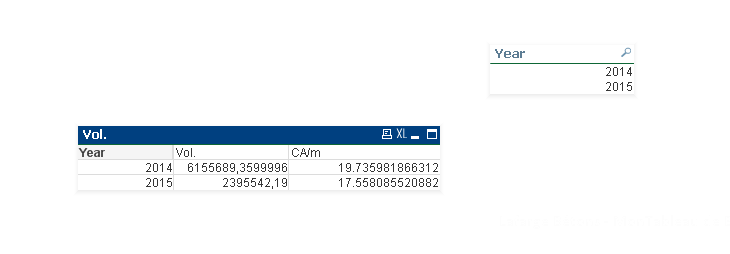
Here the table that i want to pivot