Unlock a world of possibilities! Login now and discover the exclusive benefits awaiting you.
- Qlik Community
- :
- All Forums
- :
- QlikView App Dev
- :
- Re: Conditional Coloring and Divided Legend
- Subscribe to RSS Feed
- Mark Topic as New
- Mark Topic as Read
- Float this Topic for Current User
- Bookmark
- Subscribe
- Mute
- Printer Friendly Page
- Mark as New
- Bookmark
- Subscribe
- Mute
- Subscribe to RSS Feed
- Permalink
- Report Inappropriate Content
Conditional Coloring and Divided Legend
I am having trouble conditionally formatting the colors within my chart to display red for values below zero and green for values above zero. My questions are as follows:
1) My colors are displaying based on my conditional statement, however, I like the style 'Light Gradient.' However, I wish the green would display as the other colors, in a solid manner.
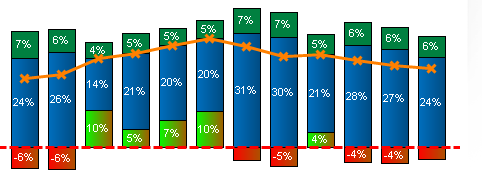
Example Chart
2) I would also like a split legend icon that represent two potential values for a single expression. For example, profit margin. If margins are below zero, it should be colored rgb(255,0,0), else rgb(0,255,0).

Example Split Legend Icon
Thanks in advance to any and all help!
Accepted Solutions
- Mark as New
- Bookmark
- Subscribe
- Mute
- Subscribe to RSS Feed
- Permalink
- Report Inappropriate Content
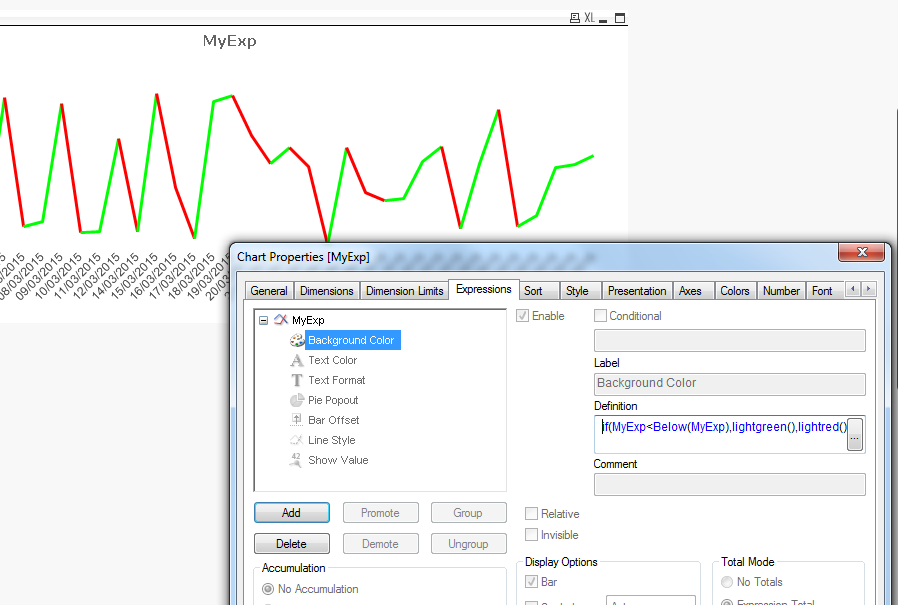
You can use the background color option of the expression (click on the plus sign in front of the expression) and use something like
if(MyExp<0,red(),green())
Where MyExp is the label of your expression (put between [] brackets if there are spaces)
- Mark as New
- Bookmark
- Subscribe
- Mute
- Subscribe to RSS Feed
- Permalink
- Report Inappropriate Content
Hi Michael,
1) Change the color in the color tab(You can not make/use gradient colors in expressions) or include it in your conditions to display a solid color.
2) that's not natively possible, but you create your own custom legend, see e.g.
- Mark as New
- Bookmark
- Subscribe
- Mute
- Subscribe to RSS Feed
- Permalink
- Report Inappropriate Content
Hi Michael,
My previous post is in moderation, probably because I referred to an external link. This is an alternative link from the community, as this moderation may take some time
1) Change the color in the color tab(You can not make/use gradient colors in expressions) or include it in your conditions to display a solid color.
2) that's not natively possible, but you create your own custom legend, see e.g.
- Mark as New
- Bookmark
- Subscribe
- Mute
- Subscribe to RSS Feed
- Permalink
- Report Inappropriate Content
Thanks for the fast reply. What is the syntax to display a solid color?
- Mark as New
- Bookmark
- Subscribe
- Mute
- Subscribe to RSS Feed
- Permalink
- Report Inappropriate Content
You can use one of the following for e.g. red
=rgb(255,0,0)
=red()
=Color(1)
for the last one, 1 is an index referring to the colors in the color tab of the chart's properties, so only if color 1 is red
- Mark as New
- Bookmark
- Subscribe
- Mute
- Subscribe to RSS Feed
- Permalink
- Report Inappropriate Content
You can use the background color option of the expression (click on the plus sign in front of the expression) and use something like
if(MyExp<0,red(),green())
Where MyExp is the label of your expression (put between [] brackets if there are spaces)
- Mark as New
- Bookmark
- Subscribe
- Mute
- Subscribe to RSS Feed
- Permalink
- Report Inappropriate Content
Thanks Piet!