Unlock a world of possibilities! Login now and discover the exclusive benefits awaiting you.
- Qlik Community
- :
- All Forums
- :
- QlikView App Dev
- :
- Re: Sum if value is greater than the average
Options
- Subscribe to RSS Feed
- Mark Topic as New
- Mark Topic as Read
- Float this Topic for Current User
- Bookmark
- Subscribe
- Mute
- Printer Friendly Page
Turn on suggestions
Auto-suggest helps you quickly narrow down your search results by suggesting possible matches as you type.
Showing results for
Anonymous
Not applicable
2015-06-28
06:54 AM
- Mark as New
- Bookmark
- Subscribe
- Mute
- Subscribe to RSS Feed
- Permalink
- Report Inappropriate Content
Sum if value is greater than the average
Hello,
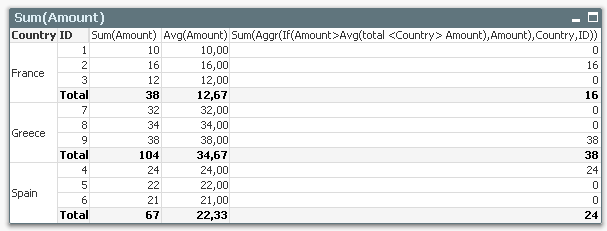
I would like to sum in chart only values that are greater than the average of this field.
for example:
Data
| ID | Country | Amount |
|---|---|---|
| 1 | France | 10 |
| 2 | France | 16 |
| 3 | France | 12 |
| 7 | Greece | 32 |
| 8 | Greece | 34 |
| 9 | Greece | 38 |
| 4 | Spain | 24 |
| 5 | Spain | 22 |
| 6 | Spain | 21 |
I use this function: sum(aggr(if(sum(Amount)>avg(TOTAL <Country> amount),sum(Amount)),Country,ID))
Chart:
| Country | Avg(Amount) | What I want to get | what I get |
| France | 12.666667 | 16 | 0 |
| Greece | 34.666667 | 38 | 0 |
| Spain | 22.333333 | 24 | 0 |
Any suggestions?
Thanks
2,168 Views
1 Solution
Accepted Solutions
MVP
2015-06-29
11:10 AM
- Mark as New
- Bookmark
- Subscribe
- Mute
- Subscribe to RSS Feed
- Permalink
- Report Inappropriate Content
Hi Amber, it should work... the Amount field in the avg is lowercase, is that a typo in the post? if not that can be the issue.
3 Replies
MVP
2015-06-29
11:10 AM
- Mark as New
- Bookmark
- Subscribe
- Mute
- Subscribe to RSS Feed
- Permalink
- Report Inappropriate Content
Hi Amber, it should work... the Amount field in the avg is lowercase, is that a typo in the post? if not that can be the issue.
Former Employee
2015-06-29
11:21 AM
- Mark as New
- Bookmark
- Subscribe
- Mute
- Subscribe to RSS Feed
- Permalink
- Report Inappropriate Content
It should work if you fix the typo.
HIC
1,219 Views
Anonymous
Not applicable
2015-06-30
02:06 AM
Author
- Mark as New
- Bookmark
- Subscribe
- Mute
- Subscribe to RSS Feed
- Permalink
- Report Inappropriate Content
Thanks!!! 
1,219 Views