Unlock a world of possibilities! Login now and discover the exclusive benefits awaiting you.
- Qlik Community
- :
- All Forums
- :
- QlikView App Dev
- :
- Re: Few Issues (Front end side )
- Subscribe to RSS Feed
- Mark Topic as New
- Mark Topic as Read
- Float this Topic for Current User
- Bookmark
- Subscribe
- Mute
- Printer Friendly Page
- Mark as New
- Bookmark
- Subscribe
- Mute
- Subscribe to RSS Feed
- Permalink
- Report Inappropriate Content
Few Issues (Front end side )
Hello Friends,
I have few issues facing while creating a Dashboard... Can someone help me out in Learning New things in Qlikview..!!
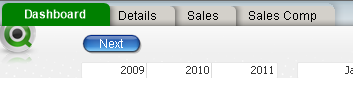
1) I need to change Sheet tab color when i navigate to next sheet...
What i mean is when i am in DashBoard Tab color should be in Green and other sheets tab color should be in white...similarly when i navigate to Details sheet.. Details sheet tab color should be Green and remaining Sheet tab colors should be in white..
2)How to give Number Format for a variable..??
I created a variables
vCountMaxCusYear=(Count({<Year={$(vMaxYear)}>} DISTINCT CustomerName))
vCountPreCusYear=(Count({<Year={$(vPreYear)}>} DISTINCT CustomerName))
And Created A Button with Text :
= '[ % Change in Customer Count : '&((vCountCusMaxYear-vCountCusPreYear)/vCountCusPreYear)*100&'% ]'
Output is 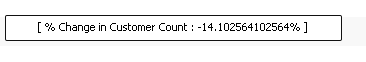
Here Value is -14.102564102564
I need.. it should be as -14.10 (its shouls be only 2 decimals)
How to changenumber format for Variable..
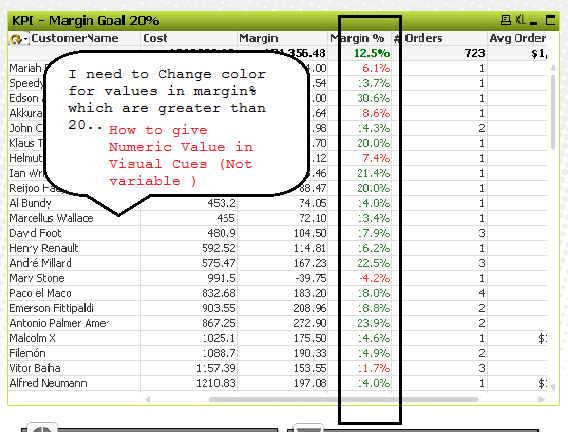
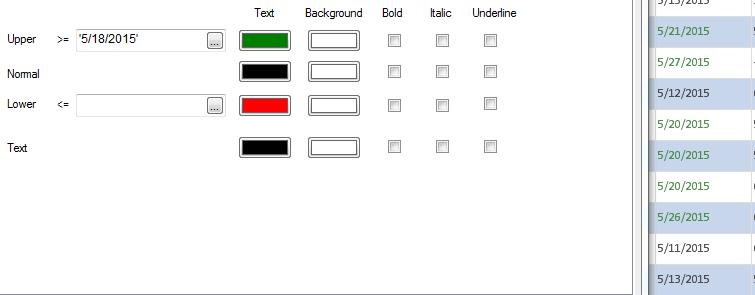
3)How to assign Numeric value in "Visual Cues" (Upper Value>=) but not Variable
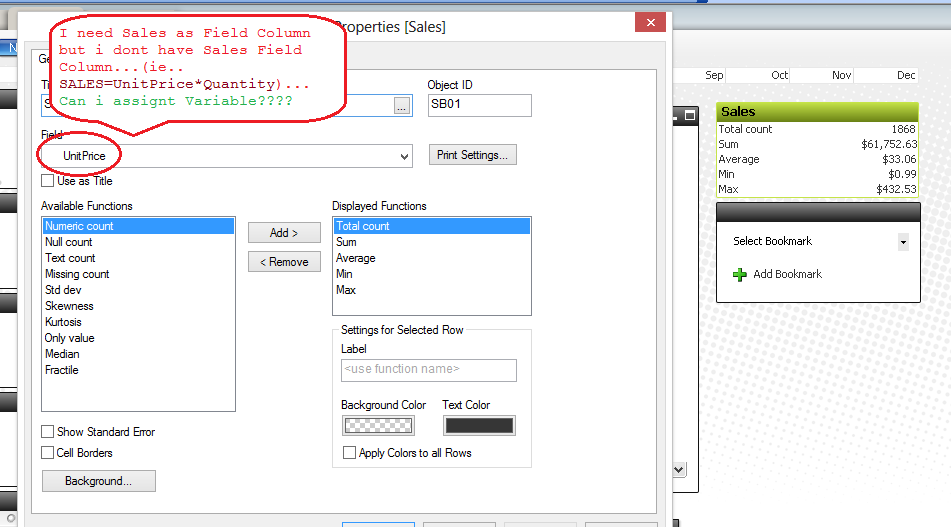
4)Can i use different columns for different Metric (i.e.. Sum, Max, Min..) in Statistics Box
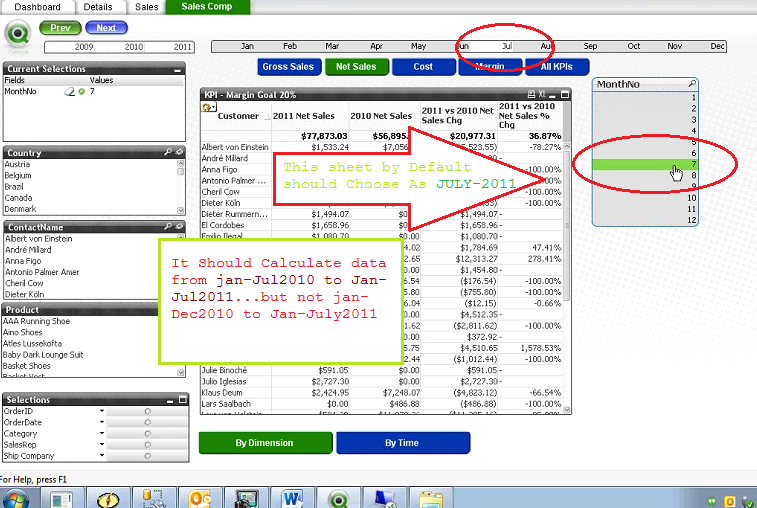
5)I have Date from jan-2009 to July- 2011..
For my Sales Corp Sheet...By default it should select July-2011... and should compare data from Jan to july for 2011 and 2010 years....
when i select 2010 it should compare data from Jan-Dec for 2010 and 2009 years...
I will be very ThankFull if someone help me please 
Thanks
Venkat
- « Previous Replies
-
- 1
- 2
- Next Replies »
- Mark as New
- Bookmark
- Subscribe
- Mute
- Subscribe to RSS Feed
- Permalink
- Report Inappropriate Content
Hi,
for 2)
num(($(vCountCusMaxYear)-$(vCountCusPreYear))/$(vCountCusPreYear)*100, '#.##0,00 %')
KR
Elena
- Mark as New
- Bookmark
- Subscribe
- Mute
- Subscribe to RSS Feed
- Permalink
- Report Inappropriate Content
for 1)
goto sheet properties, tab Settings and define custom Color and tab color
then define calculated color
=if (GetActiveSheetId()='Document\SH01',rgb(255,0,0),rgb(0,0,255))
you can use other Colors as rgb code or define variable which hold rgb code
also check the Name of SheetId
- Mark as New
- Bookmark
- Subscribe
- Mute
- Subscribe to RSS Feed
- Permalink
- Report Inappropriate Content
1. Rt Click on tab --> Sheet properties --> Check 'Custom Colors' --> Tab Color -->Calculated -->
put the expression =If(Subfield(GetActiveSheetId(),'\',2) = 'Sheet ID' ,Green(),White())
2.
vCountMaxCusYear= num(($(vCountCusMaxYear)-$(vCountCusPreYear))/$(vCountCusPreYear)*100, '#.##0,00 %')
vCountPreCusYear=num(Count({<Year={$(vPreYear)}>} DISTINCT CustomerName)), '#.##0,00 %')
Button :
= '[ % Change in Customer Count : '&
num(((vCountCusMaxYear-vCountCusPreYear)/vCountCusPreYear)*100&'% ]','#.##0,00% ')
3. enclose the value in single quotes. see below screenshot.
4. where do you want to use the expression Sales = unit Price * Qty?
in a list box? in chart as dimension or as expression or where else?
- Mark as New
- Bookmark
- Subscribe
- Mute
- Subscribe to RSS Feed
- Permalink
- Report Inappropriate Content
It's not really helpful to ask several questions in one posting, see here what you could do to get the best results from the community:
Qlik Community Tip: Best Practices for Discussi... | Qlik Community
Usage Guidelines for Qlik Community
Further thoughts on Qlik Community Guidelines
QlikCommunity Tip: How to get answers to your post?
Its not about the answer, rather it’s about the question…
Adding and Replying to Discussions
QlikCommunity Tip: Add Code to your Content
Preparing examples for Upload - Reduction and Data Scrambling
Nevertheless here some answers:
1. put an expression like this in color-option for the sheet-tab
=if(GetActiveSheetId() = 'Document\SH08', red(), white())
3. You could use options within the object-properties in tab visualizations or an attribut-expressions to the column
--> click on plus-sign by dimensions/expressions --> choose your attribut --> enten an expression like
if(sum(value) >= 0.2, red(), green())
4. You should do such a calculation within the load-script if you want access to them as field
5. Here are some examples for advanced calculations regarding to the compare of periods
How to use - Master-Calendar and Date-Values
- Marcus
- Mark as New
- Bookmark
- Subscribe
- Mute
- Subscribe to RSS Feed
- Permalink
- Report Inappropriate Content
Sales as Dimension in statistics Box....
But i dont have Dimension Sales...what i have are UnitPrice and Quantity
- Mark as New
- Bookmark
- Subscribe
- Mute
- Subscribe to RSS Feed
- Permalink
- Report Inappropriate Content
Thanks alot friends..
- Mark as New
- Bookmark
- Subscribe
- Mute
- Subscribe to RSS Feed
- Permalink
- Report Inappropriate Content
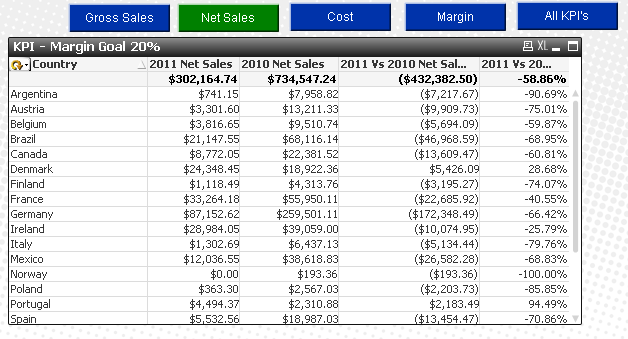
Can you check this issue please...
Why i am getting same values for Margin columns??
This is Net SAlES
This is COST
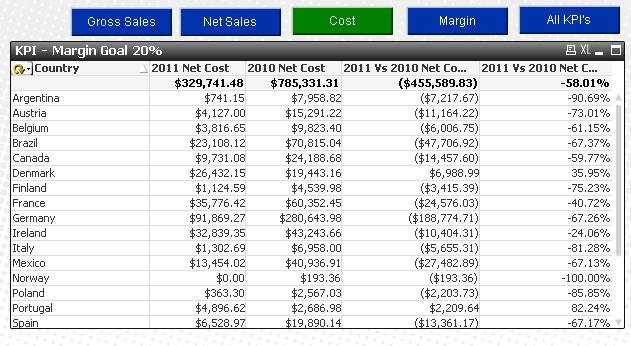
But I am getting same Values for all Countries...Why i dont know..
I defined Margin: NetSales-Cost
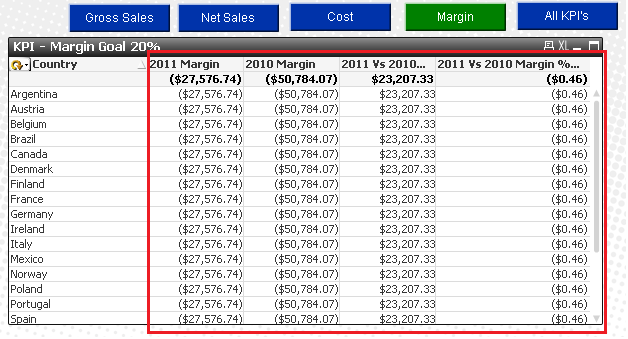
Can Some one help Me please..
Thanks
Venkat
- Mark as New
- Bookmark
- Subscribe
- Mute
- Subscribe to RSS Feed
- Permalink
- Report Inappropriate Content
You have to aggregate with respect to country.
- Mark as New
- Bookmark
- Subscribe
- Mute
- Subscribe to RSS Feed
- Permalink
- Report Inappropriate Content
Can you clearly Explain please ..!!
- « Previous Replies
-
- 1
- 2
- Next Replies »