Unlock a world of possibilities! Login now and discover the exclusive benefits awaiting you.
- Qlik Community
- :
- All Forums
- :
- QlikView App Dev
- :
- Re: Char problem
- Subscribe to RSS Feed
- Mark Topic as New
- Mark Topic as Read
- Float this Topic for Current User
- Bookmark
- Subscribe
- Mute
- Printer Friendly Page
- Mark as New
- Bookmark
- Subscribe
- Mute
- Subscribe to RSS Feed
- Permalink
- Report Inappropriate Content
Char problem
Hi All,
If some one can answer this question and please help me out
My problem is i want to show only tweleve months data in my chart if new month will add in my data them older month automatily exclude from my chart table.
Table 1
Jun-14 | 5 |
Jul-14 | 10 |
Aug-14 | 1 |
Sep-14 | 1 |
Oct-14 | 3 |
Nov-14 | 2 |
Dec-14 | 31 |
Jan-15 | 00 |
Feb-15 | 2 |
Mar-15 | 30 |
Apr-15 | 292 |
May-15 | 291 |
Table 2
Jul-14 | 10 |
Aug-14 | 1 |
Sep-14 | 1 |
Oct-14 | 3 |
Nov-14 | 2 |
Dec-14 | 31 |
Jan-15 | 00 |
Feb-15 | 2 |
Mar-15 | 30 |
Apr-15 | 12 |
May-15 | 35 |
Jun-15 | 34 |
As per my table Example in my first table i have data JUN-14 to MAY-2015 and and in my Second table i have Jul-14 to Jun-15.
It means in my second table jun-15 is added and Jun-14 is removed from the table.
So this type of representation i want for all the coming month.
Please help me
regards
Balram
- Mark as New
- Bookmark
- Subscribe
- Mute
- Subscribe to RSS Feed
- Permalink
- Report Inappropriate Content
Hi,
can this Set analisys help you?
Sum({<Date01 = {">=$(=Monthstart(addmonths(Max(Date01),-12)))"}>}Amount)
Regards.
- Mark as New
- Bookmark
- Subscribe
- Mute
- Subscribe to RSS Feed
- Permalink
- Report Inappropriate Content
or
add a month serial field to your calendar table
year(Date)*12 + month(Date) as MonthSerial
last 12 months are
sum({$ <MonthSerial={">=$(=max(MonthSerial)-11)"}>} Amount)
- Mark as New
- Bookmark
- Subscribe
- Mute
- Subscribe to RSS Feed
- Permalink
- Report Inappropriate Content
Hi Balram
This is a good case for using a calculated dimension with the 'Suppress When Value Is Null' option ticked.
Essentially you are saying that you only want to show 12 results which are the current MonthYear and the previous 11 MonthYears. This is the same as saying display all MonthYear values where the MonthYear is greater than or equal to the current MonthYear-12.
To use this in a calculated dimension:
Firstly I assume data to be the following:
MonthYear,Value
01/06/2014,5
01/07/2014,10
01/08/2014,1
01/09/2014,1
01/10/2014,3
01/11/2014,2
01/12/2014,31
01/01/2015,5
01/02/2015,2
01/03/2015,30
01/04/2015,292
01/05/2015,291
01/06/2015,300
01/07/2015,234
I created a straight table using a calculated dimension and Sum(Value) as the expression.
The calculated dimension was:
= If(MonthYear>= Addmonths(Now(),-12) ,MonthYear,)
This is basically saying that if the value of MonthYear is greater than or equal to the value of the current MonthYear-12 then display the MonthYear, otherwise hide the values. It is critical that you tick the 'Suppress When Value Is Null' option for this to work.

The resulting straight table will show:
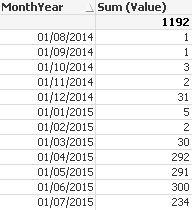
i.e. showing the last 12 months of data based on the date on which you open the application. Note June and July 2014 data is not displayed.
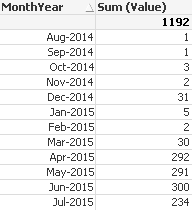
You can format the MonthYear to show MMM-YYYY, in which case adapt the calculated dimension to:
=Date(
If(MonthYear>=
Addmonths(Now(),-12)
,MonthYear,)
,'MMM-YYYY')
which will then display
If you have 0 values against a month you will have to set up a master calendar to avoid gaps in your data.
Hope that helps.
Kind regards
Steve