Unlock a world of possibilities! Login now and discover the exclusive benefits awaiting you.
- Qlik Community
- :
- Forums
- :
- Analytics
- :
- New to Qlik Analytics
- :
- Re: QLIK SENSE: i have a dream (2)
- Subscribe to RSS Feed
- Mark Topic as New
- Mark Topic as Read
- Float this Topic for Current User
- Bookmark
- Subscribe
- Mute
- Printer Friendly Page
- Mark as New
- Bookmark
- Subscribe
- Mute
- Subscribe to RSS Feed
- Permalink
- Report Inappropriate Content
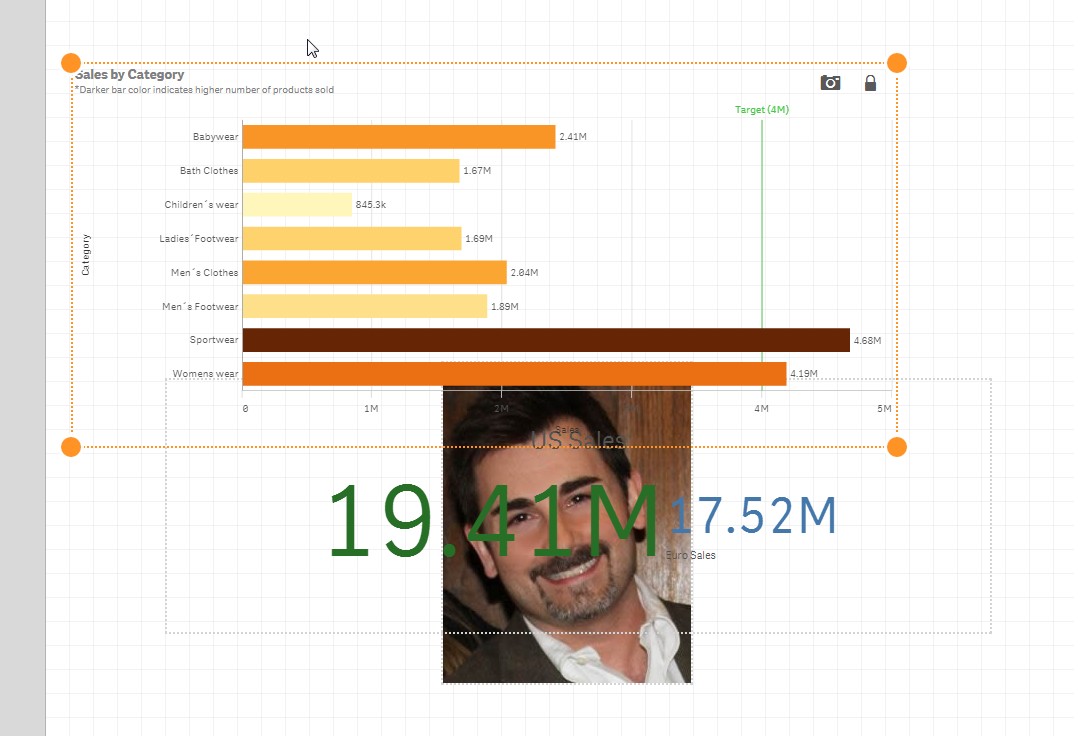
Ability to overlay charts, text and images
Hi Community,
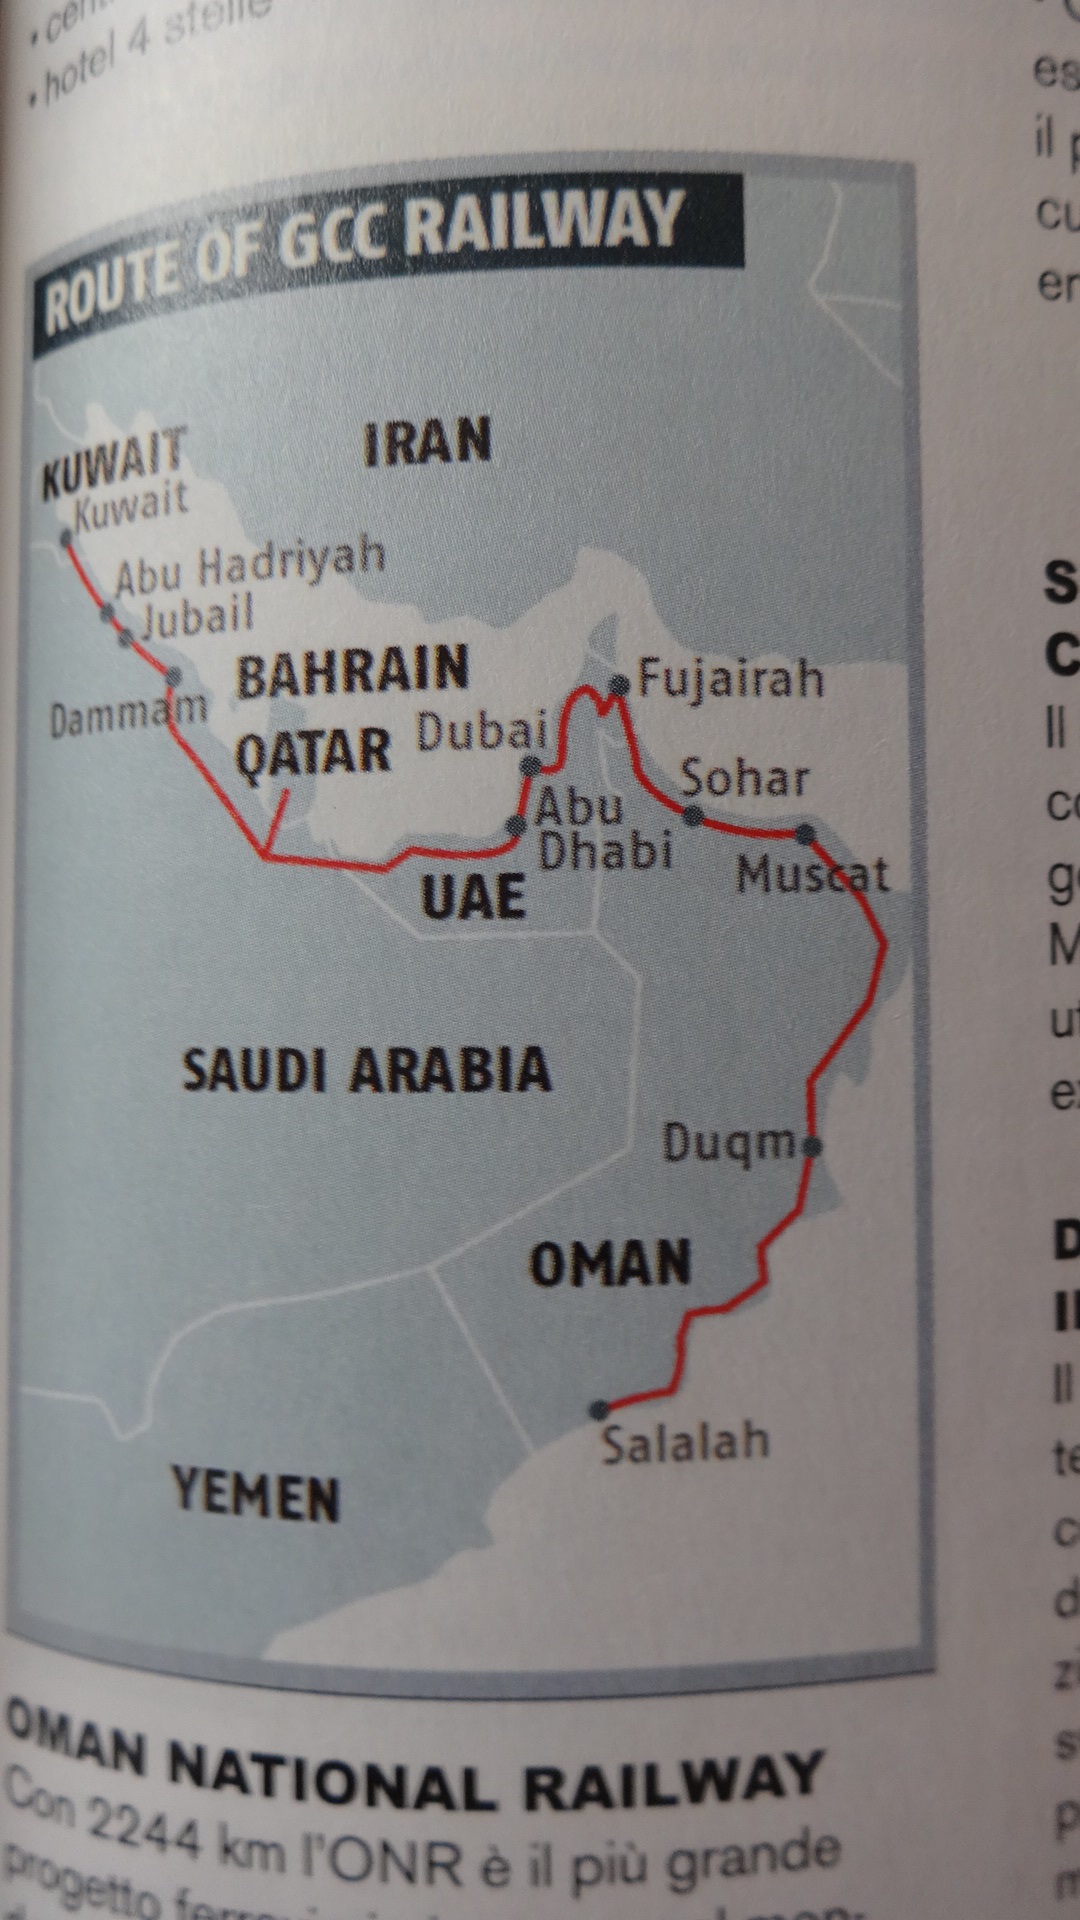
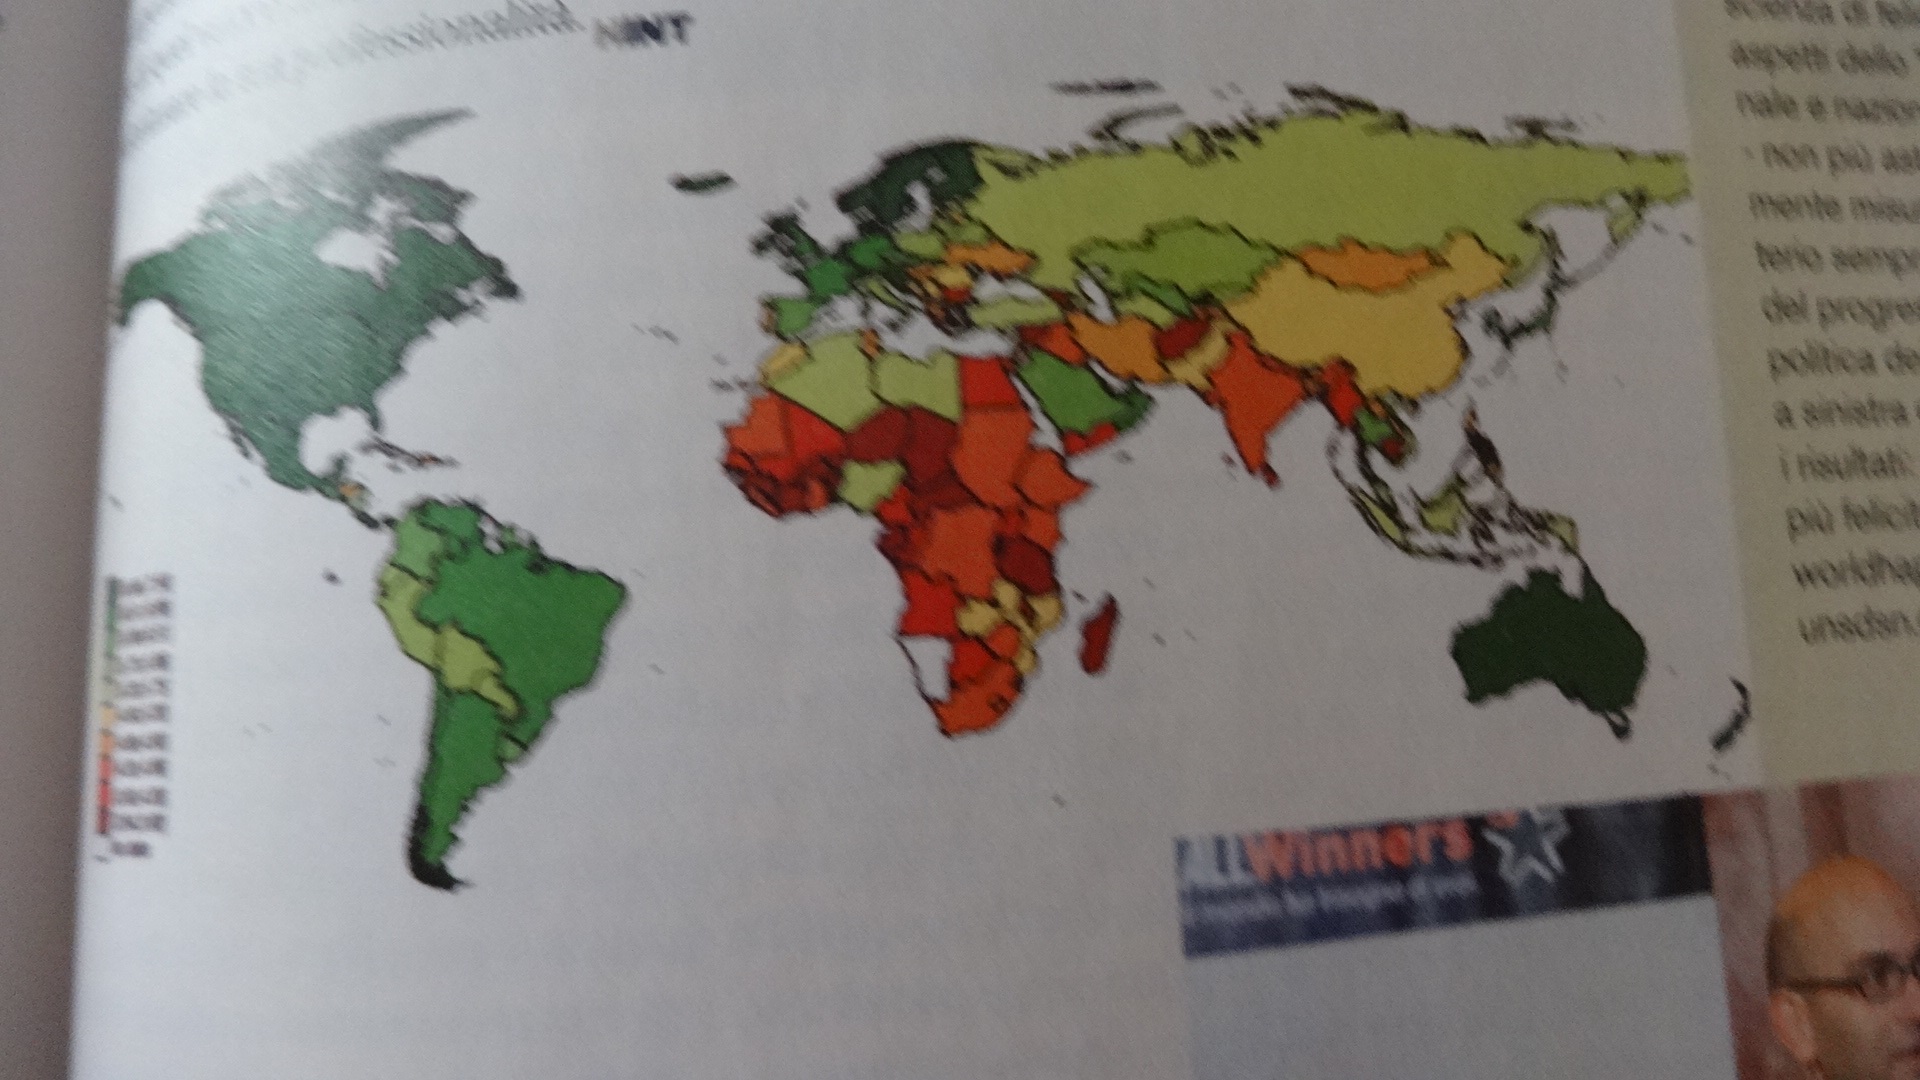
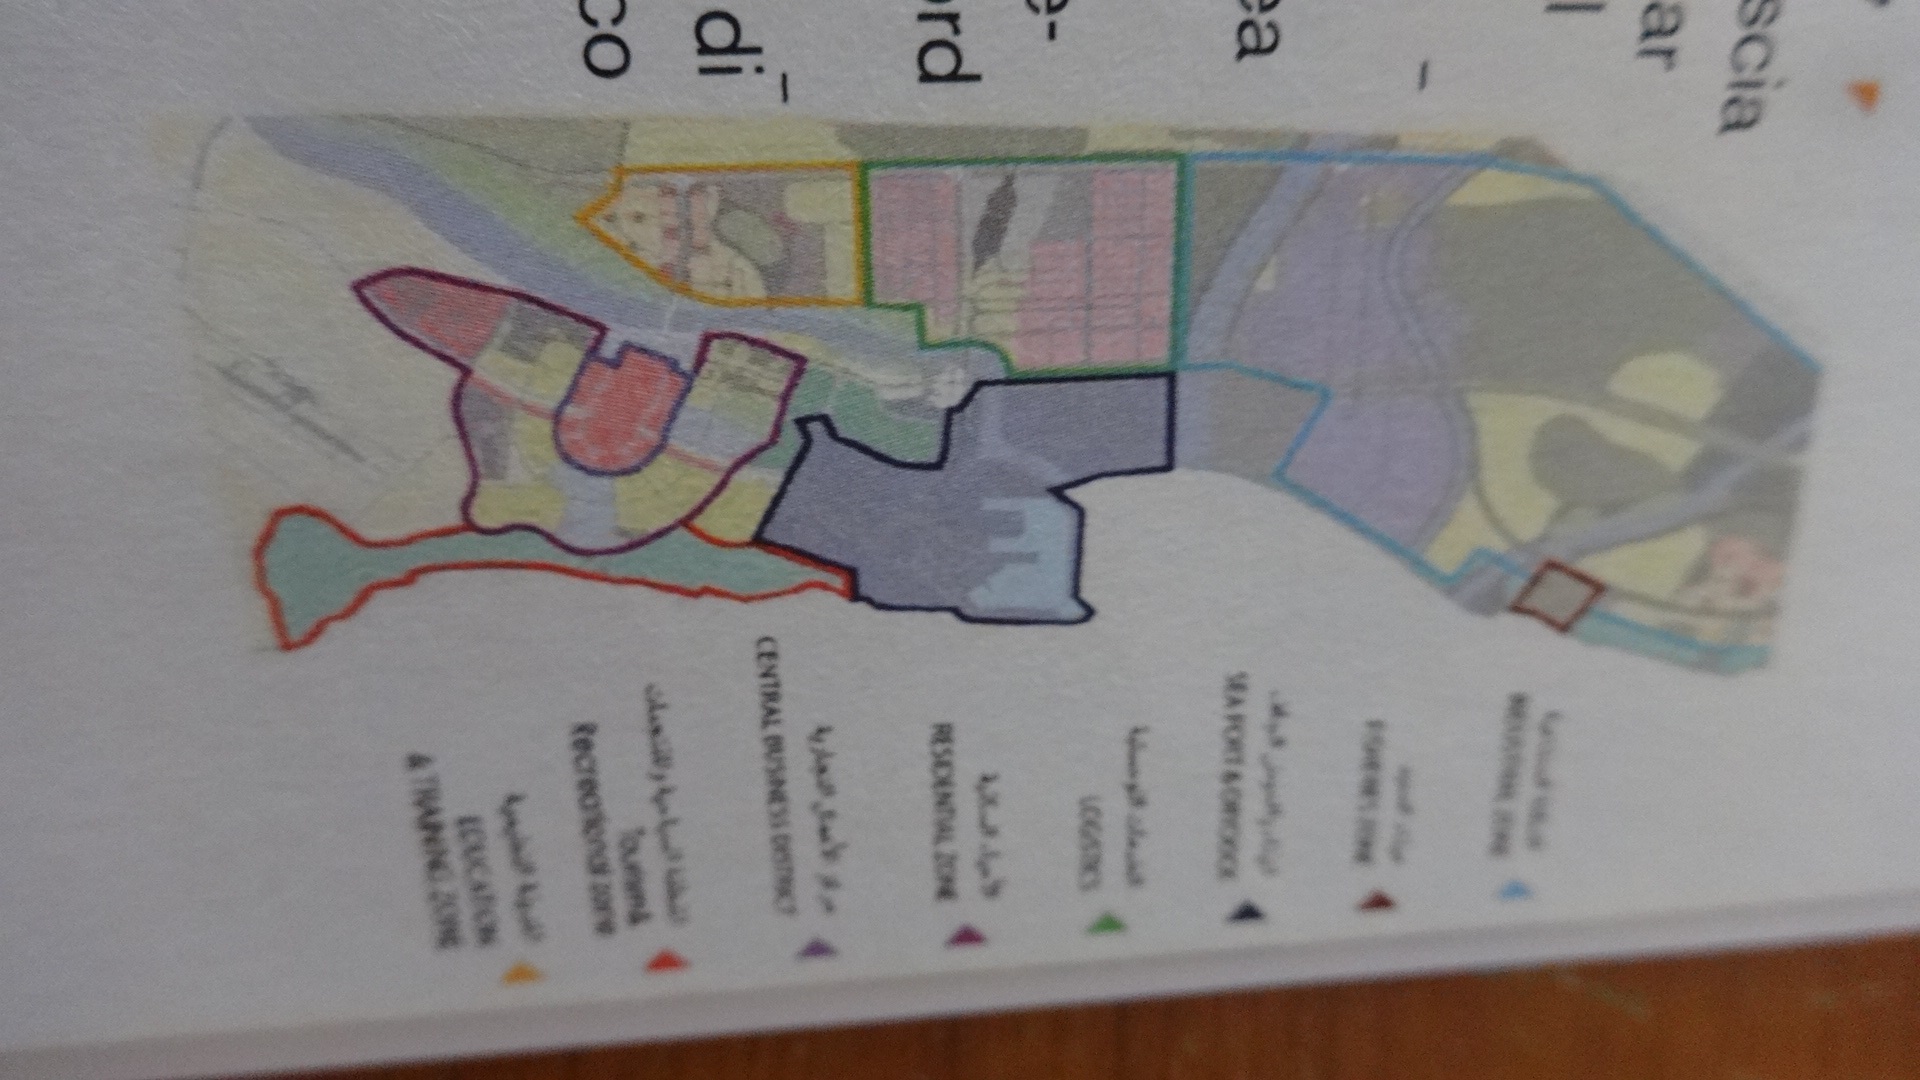
i'm using qlik sense vers. 2.0 and I would realize a similar chart.
I'm trying myself, i'm looking for .. post, video but I'm not enable to achieve my objective.
I would like .... see example
- Mark as New
- Bookmark
- Subscribe
- Mute
- Subscribe to RSS Feed
- Permalink
- Report Inappropriate Content
Hi Fabio
What kind of maps do you want? all of the image?
in sense you could create some maps but all about KML forms and points maps not route
you can try with geoqlik or qlikmaps that extensions will allow you to create that kind of maps that you attach in the image.
see this link,hope helps
Qlik Sense – Map Chart Object Part 3 – 1.1 Update (video)
GeoQlik (Business Geografic), Platinum Sponsor of Qonnections 2015
Fernando
- Mark as New
- Bookmark
- Subscribe
- Mute
- Subscribe to RSS Feed
- Permalink
- Report Inappropriate Content
hi,
i'm newbie about qlik but I spent several hours to watch video and read posts.
I think that I wanted to make something that the program does not support using qlik sense personal edition.
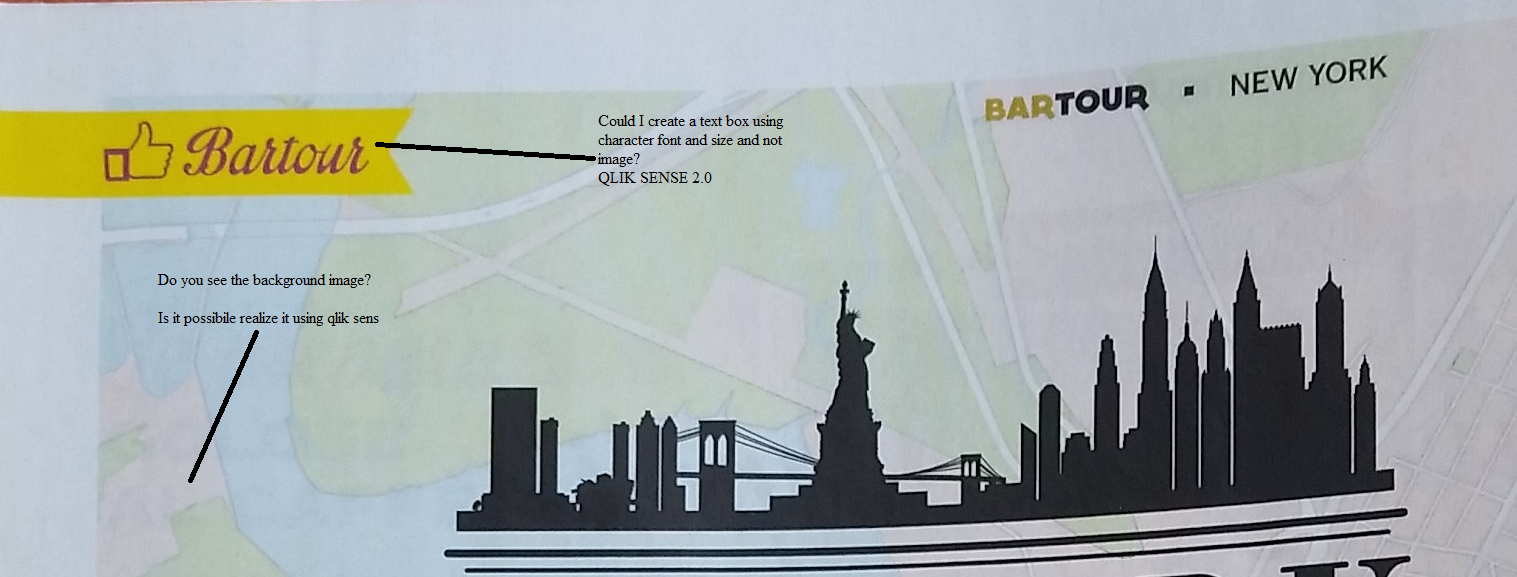
The links indicated have already been viewed , but not a matter of how to achieve but to understand its potential. I wish I had the opportunity to place background images on which collacare texts and data tables ( overlay ).
See example attached
- Mark as New
- Bookmark
- Subscribe
- Mute
- Subscribe to RSS Feed
- Permalink
- Report Inappropriate Content
Hi,
since Qlik Sense uses web technology I don't see a barrier not to make this kind of things. But you will need to dive deeper. Some things you can accomplish with standard (built-in) components, for others you will need to create things with extensions or mashups. You should separate your requirements and ask for help for the specific one, like "text box" and "map background" etc..
- Ralf
- Mark as New
- Bookmark
- Subscribe
- Mute
- Subscribe to RSS Feed
- Permalink
- Report Inappropriate Content

Thanks
- Mark as New
- Bookmark
- Subscribe
- Mute
- Subscribe to RSS Feed
- Permalink
- Report Inappropriate Content
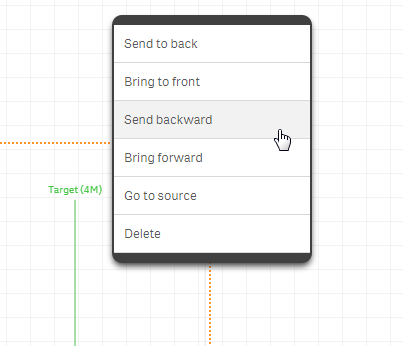
Hi Fabio - one thought here - is you can use the Data Story telling feature and layout your objects and overlay text and images. You can arrange the layer order too,
Using data storytelling - YouTube
Please mark the appropriate replies as CORRECT / HELPFUL so our team and other members know that your question(s) has been answered to your satisfaction.
Regards,
Mike Tarallo
Qlik
Mike Tarallo
Qlik
- Mark as New
- Bookmark
- Subscribe
- Mute
- Subscribe to RSS Feed
- Permalink
- Report Inappropriate Content
thanks for the reply . I write because I want to know the different post strengths and weaknesses of the program . My idea of graphics described by words or images . I do 5 graphics on a page creates a bit of boredom . While reading numbers is accompanied by images more engaging . But it is my personal idea
- Mark as New
- Bookmark
- Subscribe
- Mute
- Subscribe to RSS Feed
- Permalink
- Report Inappropriate Content
Fabio,
Good to hear. One more thought, perhaps you may also find that you can export the Qlik Sense chart object to an image file and then use that image in another publishing tool that can design a layout for you to mix text and graphics.
Qlik Sense is a self-service data visualization tool, and is not really meant to be used in the manner you are speaking which is more related to that of desktop publishing. However, Qlik Sense does give you the tools to possibly accomplish your goal, such as developing your analysis and exporting your findings (chart object) as an image:
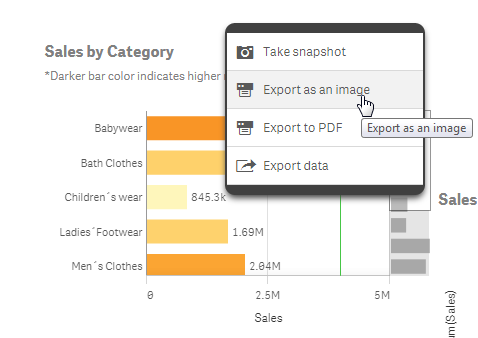
This way you can include your image in the another software tool that you may use to assemble your layoutm text and graphics, etc.
Please mark the appropriate replies as CORRECT / HELPFUL so our team and other members know that your question(s) has been answered to your satisfaction.
Regards,
Mike Tarallo
Qlik
Mike Tarallo
Qlik