Unlock a world of possibilities! Login now and discover the exclusive benefits awaiting you.
- Qlik Community
- :
- All Forums
- :
- QlikView App Dev
- :
- Re: Set Analysis
- Subscribe to RSS Feed
- Mark Topic as New
- Mark Topic as Read
- Float this Topic for Current User
- Bookmark
- Subscribe
- Mute
- Printer Friendly Page
- Mark as New
- Bookmark
- Subscribe
- Mute
- Subscribe to RSS Feed
- Permalink
- Report Inappropriate Content
Set Analysis
I have a question. I have a table with material ID, PO, category code and PO value. For one PO, there maybe various material ID and category codes. Now I would like to make a report with Cagegory code and PO values in which one PO maps to the PCS with biggest value in the PO.
- Tags:
- new_to_qlikview
- « Previous Replies
-
- 1
- 2
- Next Replies »
- Mark as New
- Bookmark
- Subscribe
- Mute
- Subscribe to RSS Feed
- Permalink
- Report Inappropriate Content
Could you post sample of your data?
- Mark as New
- Bookmark
- Subscribe
- Mute
- Subscribe to RSS Feed
- Permalink
- Report Inappropriate Content
Thank you, Robert. Here is the sample of the data. Is it possible to achieve it through Set Analysis?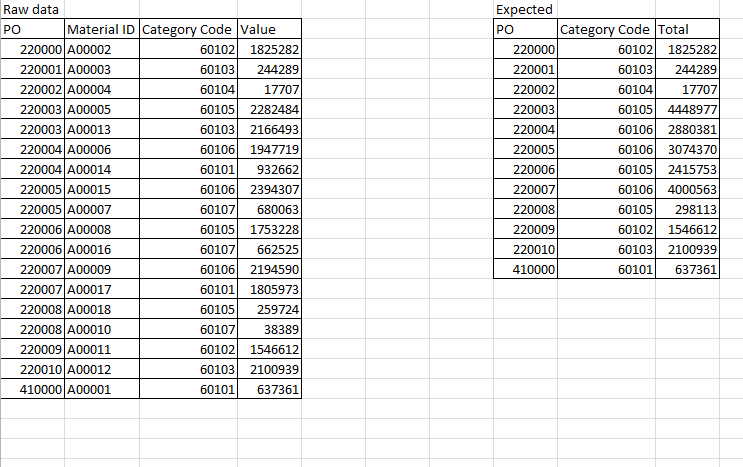
- Mark as New
- Bookmark
- Subscribe
- Mute
- Subscribe to RSS Feed
- Permalink
- Report Inappropriate Content
Please post an excel file instead of a screenshot.
Best,
Sunny
- Mark as New
- Bookmark
- Subscribe
- Mute
- Subscribe to RSS Feed
- Permalink
- Report Inappropriate Content
hi Alan,
you can create a straight table and select dimension as PO and category type, and expression as
=aggr( sum(Value), PO).
you would get the expected result.
Thanks
Saurabh
- Mark as New
- Bookmark
- Subscribe
- Mute
- Subscribe to RSS Feed
- Permalink
- Report Inappropriate Content
Dear Sunny,
I can not find where to post a excel file. I only have the options of image or link. Would you please let me know how to post a excel file. Thanks.
Regards,
Alan
- Mark as New
- Bookmark
- Subscribe
- Mute
- Subscribe to RSS Feed
- Permalink
- Report Inappropriate Content
Dear Sunny, please try this link. Thanks.https://community.qlik.com/docs/DOC-8897
- Mark as New
- Bookmark
- Subscribe
- Mute
- Subscribe to RSS Feed
- Permalink
- Report Inappropriate Content
Hi Saurabh,
Many thanks for your help. I appreciate it very much.
There is still one thing pending here. I am trying to recognize the category code with highest amount in the PO and use it to map each PO. Any idea how to do it?
Thanks.
- Mark as New
- Bookmark
- Subscribe
- Mute
- Subscribe to RSS Feed
- Permalink
- Report Inappropriate Content
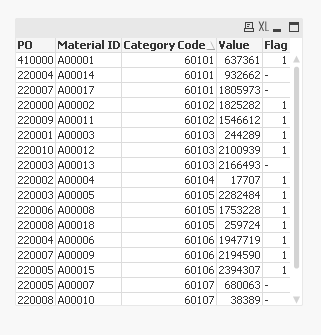
Create a flag in the script:
Table:
LOAD PO,
[Material ID],
[Category Code],
Value
FROM
Community_172509.xlsx
(ooxml, embedded labels, table is Sheet1);
Join(Table)
LOAD PO,
FirstValue([Category Code]) as [Category Code],
1 as Flag
Resident Table
Group By PO;
Output in straight table (to see the flag)
Now to get your expected output, create a straight table with
Dimension: PO
Expressions:
1. =Only({<Flag = {1}>} [Category Code])
2. =Sum(Value)
Output of straight table:
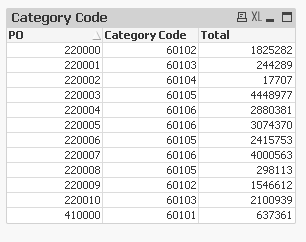
Attaching the qvw document for reference.
HTH
Best,
Sunny
- Mark as New
- Bookmark
- Subscribe
- Mute
- Subscribe to RSS Feed
- Permalink
- Report Inappropriate Content
I think you can use PO as your first Dimension, and a second calculated dimension to select the largest Category for each PO as:
=if([Category Code]=
aggr(
FirstSortedValue([Category Code],
-aggr(sum(Value), [Category Code])
)
,PO)
,[Category Code])
-Rob
- « Previous Replies
-
- 1
- 2
- Next Replies »