Unlock a world of possibilities! Login now and discover the exclusive benefits awaiting you.
- Qlik Community
- :
- All Forums
- :
- QlikView App Dev
- :
- How can I show only every 10th value on x axis?
- Subscribe to RSS Feed
- Mark Topic as New
- Mark Topic as Read
- Float this Topic for Current User
- Bookmark
- Subscribe
- Mute
- Printer Friendly Page
- Mark as New
- Bookmark
- Subscribe
- Mute
- Subscribe to RSS Feed
- Permalink
- Report Inappropriate Content
How can I show only every 10th value on x axis?
Hi,
I have big chart with 600 values on the x axis.
is is possible to show only every 10th value, so I will have only 60 values on th x axis als legend
thanks
Bumin
- « Previous Replies
-
- 1
- 2
- Next Replies »
Accepted Solutions
- Mark as New
- Bookmark
- Subscribe
- Mute
- Subscribe to RSS Feed
- Permalink
- Report Inappropriate Content
You could try this :
- Create an additional expression with an IF statement to only display the Dim values you want
- = if ( Dim = 'B' , Dim , '' )
- This will only show where Dim is B, you'll need to sort your own logic here for every 10th value
- For this expression tick Text on Axis and untick all other Display Options
- For the Dimension untick Show Legend
- You may need to use <Ctrl><Shift> to move / resize your Chart sub objects.
- Mark as New
- Bookmark
- Subscribe
- Mute
- Subscribe to RSS Feed
- Permalink
- Report Inappropriate Content
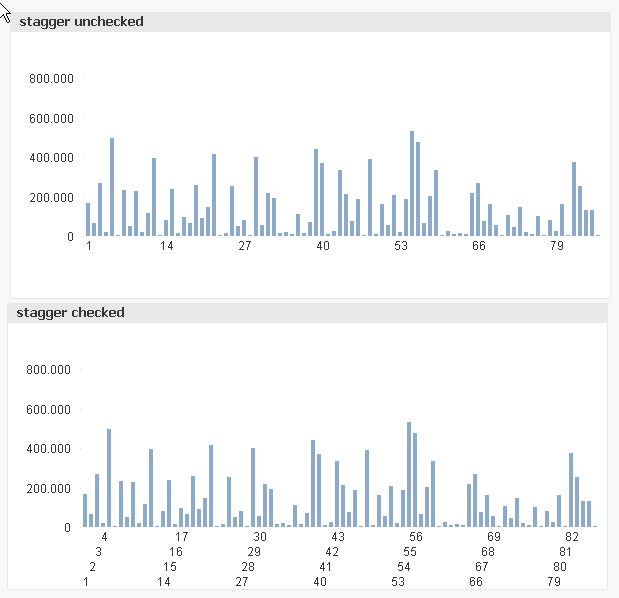
did you already try to uncheck stagger labels in axis tab? you get few values on x-axis (maybe not only every 10th)
- Mark as New
- Bookmark
- Subscribe
- Mute
- Subscribe to RSS Feed
- Permalink
- Report Inappropriate Content
Hi Massimo,
I have uncheked "stagger labels". But still I have the same number of values on the x axis legend
- Mark as New
- Bookmark
- Subscribe
- Mute
- Subscribe to RSS Feed
- Permalink
- Report Inappropriate Content
Within the tab presentation (top right) is an option to limit the count of x-axis values with a possibility to use an scrollbar.
- Marcus
- Mark as New
- Bookmark
- Subscribe
- Mute
- Subscribe to RSS Feed
- Permalink
- Report Inappropriate Content
but it want to see all values on one view.
I just want to show less legend on the x axis
- Mark as New
- Bookmark
- Subscribe
- Mute
- Subscribe to RSS Feed
- Permalink
- Report Inappropriate Content
this is what I get with unchecked/checked stagger
- Mark as New
- Bookmark
- Subscribe
- Mute
- Subscribe to RSS Feed
- Permalink
- Report Inappropriate Content
yes you are rigth. It shows less
- Mark as New
- Bookmark
- Subscribe
- Mute
- Subscribe to RSS Feed
- Permalink
- Report Inappropriate Content
You could try this :
- Create an additional expression with an IF statement to only display the Dim values you want
- = if ( Dim = 'B' , Dim , '' )
- This will only show where Dim is B, you'll need to sort your own logic here for every 10th value
- For this expression tick Text on Axis and untick all other Display Options
- For the Dimension untick Show Legend
- You may need to use <Ctrl><Shift> to move / resize your Chart sub objects.
- Mark as New
- Bookmark
- Subscribe
- Mute
- Subscribe to RSS Feed
- Permalink
- Report Inappropriate Content
very nice solution , thanks
- Mark as New
- Bookmark
- Subscribe
- Mute
- Subscribe to RSS Feed
- Permalink
- Report Inappropriate Content
I have found it useful, when I wish display data at daily granularity, but label it monthly.
Also by using the GetPossibleCount() function on your dimension you can get it to flex how many labels are displayed for the number of data points.
- « Previous Replies
-
- 1
- 2
- Next Replies »