Unlock a world of possibilities! Login now and discover the exclusive benefits awaiting you.
- Qlik Community
- :
- Forums
- :
- Analytics
- :
- New to Qlik Analytics
- :
- Re: Table With Horizontal Scrollbar
- Subscribe to RSS Feed
- Mark Topic as New
- Mark Topic as Read
- Float this Topic for Current User
- Bookmark
- Subscribe
- Mute
- Printer Friendly Page
- Mark as New
- Bookmark
- Subscribe
- Mute
- Subscribe to RSS Feed
- Permalink
- Report Inappropriate Content
Table With Horizontal Scrollbar
Hello
I have added about 13 columns only 8 of them show on the chart, there is no scrollbar at the bottom of the chart .
Thanks in advance for your help
- Mark as New
- Bookmark
- Subscribe
- Mute
- Subscribe to RSS Feed
- Permalink
- Report Inappropriate Content
@meriem.aboulaayad Did you find any solution to this problem ?
I am facing the same issue.....
- Mark as New
- Bookmark
- Subscribe
- Mute
- Subscribe to RSS Feed
- Permalink
- Report Inappropriate Content
Hi,
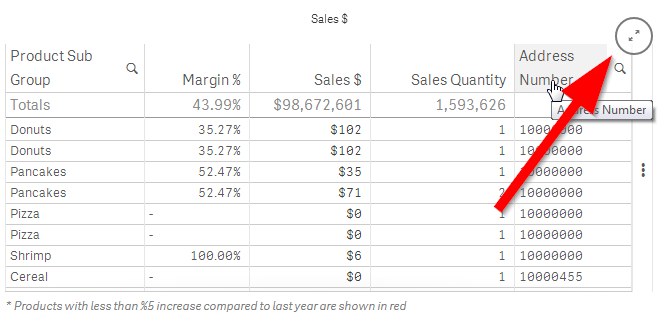
When there is insufficient space to include all columns, Qlik Sense does not add a horizontal scroll bar but add three dots on the left of the table. If you click (or touch) on these dots you will get a menu where you can drag columns above the dotted line so they are displayed.

If you'd like to view more columns at the same time you can maximize the table. Qlik Sense will then adjust the chart to the additional screen area and display as many columns as fit.
You may be wondering why Qlik Sense doesn't have a horizontal scroll bar. From what I understand from our UI/UX experts large tables are a very poor way to display data. Humans have difficulty interpret large tables of data so Qlik Sense intentionally encourages alternative solutions.
-Josh
Qlik
- Mark as New
- Bookmark
- Subscribe
- Mute
- Subscribe to RSS Feed
- Permalink
- Report Inappropriate Content
hello,
i am sorry, i did't find any solution for that.
You can juste try to use a fond smaller and rise the heigh of your chart to view more row.
- Mark as New
- Bookmark
- Subscribe
- Mute
- Subscribe to RSS Feed
- Permalink
- Report Inappropriate Content
Hi Josh,
UI experts may think large tables are a poor way to display data but I have a team of sales reps that want to view a table of their sales orders with all the details of each order line within the columns. How would your UI experts advise that information down at a detail level like this be viewed?
At present QlikSense doesn't seem to provide a way this information can easily be viewed because the column widths in the pivot table are in no way adjustable and a large amount of columns makes them unreadable as they are squashed up too much, rather than allowing a column size to fit the data and then the user to scroll across to view the information..
- Mark as New
- Bookmark
- Subscribe
- Mute
- Subscribe to RSS Feed
- Permalink
- Report Inappropriate Content
Hi Ben,
Apologies for the slow response, I was away last week. The pivot table does a have the ability to scroll so you can do it using that visualization. The straight table uses the pick list approach when there is not enough room to display all column. If the users is willing to make the trade-off of smaller font to display more column then the user can zoom the webpage (ctrl-mouse wheel). Qlik Sense's responsive design will re-render and display more column in a straight table.
I hope this helps.
-Josh
Qlik
- Mark as New
- Bookmark
- Subscribe
- Mute
- Subscribe to RSS Feed
- Permalink
- Report Inappropriate Content
Hi Josh,
Regardless, if the user has a scroll bar or the ability to drag columns above the dotted line so they are displayed, the same number of columns will be displayed on the screen, so what the UI/UX experts say is a moot point as it pertains to this issue. My users would like to see the scroll bar so they can easily "scroll" through the data rather than selecting the columns they would like visible. It would be nice if Qlik added this functionality to Qlik Sense. Thank you.
- Mark as New
- Bookmark
- Subscribe
- Mute
- Subscribe to RSS Feed
- Permalink
- Report Inappropriate Content
Hi Josh,
Some time has passed since I first posted this and I have had demo'd QlikSense to several clients. Every time I have demo'd it I have not been able to get it across the line because of the inability to show lots of columns on a pivot table in a usable way. Whether the UI/UX experts think this should be done or not doesn't really matter. It is the customers that have the final say as to whether it works for them or not (and ultimately if they buy it or not!). Unfortunately at the moment it doesn't meet their requirements.
Cheers
Ben
- Mark as New
- Bookmark
- Subscribe
- Mute
- Subscribe to RSS Feed
- Permalink
- Report Inappropriate Content
Ed & ben.robison thank you for your honest and direct feedback on this. I do see your point and I have passed it along to our UX team. One of the best things about Qlik Sense is that open and standard APIs so it can be customized however you'd like (with a little effort) or by leveraging the work of other on Qlik Branch. For example the JS Pivot Table for Qlik Sense will display a scroll bar when there are more columns that will fit in the provided space.
I hope this helps and thank you again for the feedback.
-Josh
Qlik