Unlock a world of possibilities! Login now and discover the exclusive benefits awaiting you.
- Qlik Community
- :
- All Forums
- :
- Qlik NPrinting
- :
- Re: Pixel Perfect Report Layout Issue
- Subscribe to RSS Feed
- Mark Topic as New
- Mark Topic as Read
- Float this Topic for Current User
- Bookmark
- Subscribe
- Mute
- Printer Friendly Page
- Mark as New
- Bookmark
- Subscribe
- Mute
- Subscribe to RSS Feed
- Permalink
- Report Inappropriate Content
Pixel Perfect Report Layout Issue
Hi All,
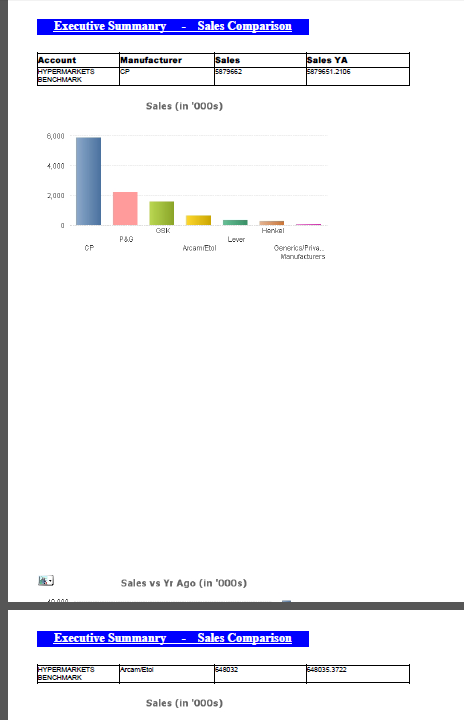
I am trying to create pixel perfect report with one table and two charts. The Preview is not what I want. I expect a table and two charts.
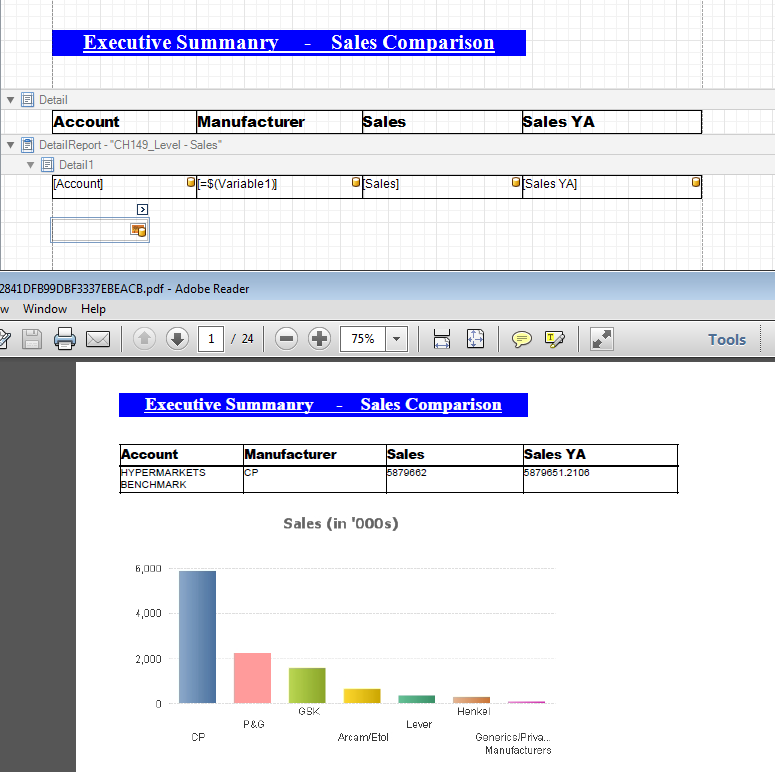
Table comes up with one row and then chart and next row of the table and chart. I am attaching output and also a screenshot of layout from designer. Please guide me on what is that I am missing here. Tables has 20 rows and I expect them first and then chart.
Design:
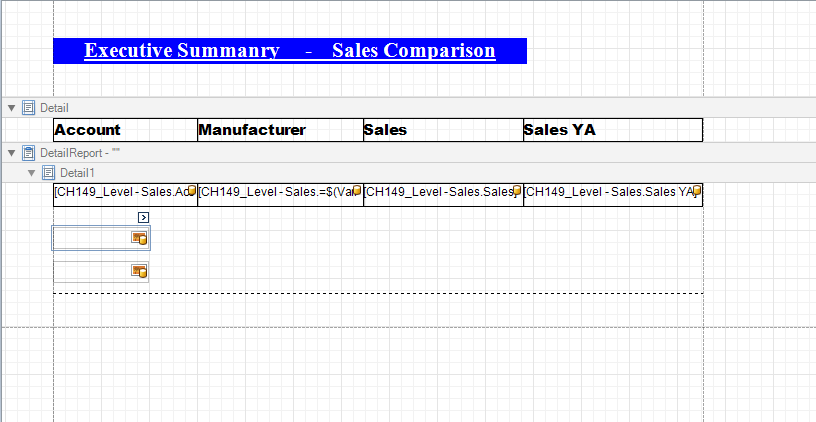
Layout
Accepted Solutions
- Mark as New
- Bookmark
- Subscribe
- Mute
- Subscribe to RSS Feed
- Permalink
- Report Inappropriate Content
Looks like one step was missed. You need to have a level added in the field list.
Right click in the detail area -> Insert detail report -> "CH149_Level"
Then you drag in your columns and you should get the expected output
How to Create PixelPerfect Reports with a Level – Customer Feedback for Vizubi
- Mark as New
- Bookmark
- Subscribe
- Mute
- Subscribe to RSS Feed
- Permalink
- Report Inappropriate Content
Same issue,, sorry I have added that level now. but Table one row at a time and chart comes up rather than whole table contents at one place.
- Mark as New
- Bookmark
- Subscribe
- Mute
- Subscribe to RSS Feed
- Permalink
- Report Inappropriate Content
Hi Faisal,
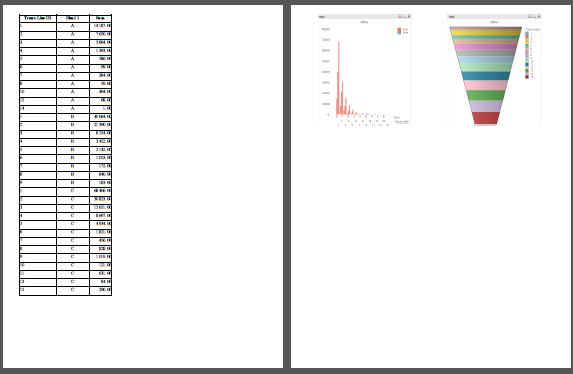
Nate is correct. It appears that you have not added the levels required. I have attached a sample project with a PixelPerfect report template demonstrating what you are trying to achieve.
Please extract to C:\Temp\FM to preserve the paths used or you will need to change them in the NSQ.
HTH - Daniel.
- Mark as New
- Bookmark
- Subscribe
- Mute
- Subscribe to RSS Feed
- Permalink
- Report Inappropriate Content
Hi Faisal,
From the screenshots it seems that the two charts are inside the level that create the table, so:
- as suggested by Daniel, be sure to have added the level in the Levels node to create all the table rows
- after that be sure to add the two charts outside the level band otherwise you'll have one chart for each row of the table.
I hope this helps.
Best Regards,
Ruggero
Best Regards,
Ruggero
---------------------------------------------
When applicable please mark the appropriate replies as CORRECT. This will help community members and Qlik Employees know which discussions have already been addressed and have a possible known solution. Please mark threads with a LIKE if the provided solution is helpful to the problem, but does not necessarily solve the indicated problem. You can mark multiple threads with LIKEs if you feel additional info is useful to others.