Unlock a world of possibilities! Login now and discover the exclusive benefits awaiting you.
- Qlik Community
- :
- All Forums
- :
- QlikView App Dev
- :
- Re: How to: Average line based on expression value...
- Subscribe to RSS Feed
- Mark Topic as New
- Mark Topic as Read
- Float this Topic for Current User
- Bookmark
- Subscribe
- Mute
- Printer Friendly Page
- Mark as New
- Bookmark
- Subscribe
- Mute
- Subscribe to RSS Feed
- Permalink
- Report Inappropriate Content
How to: Average line based on expression values
Dear Qlikviewers,
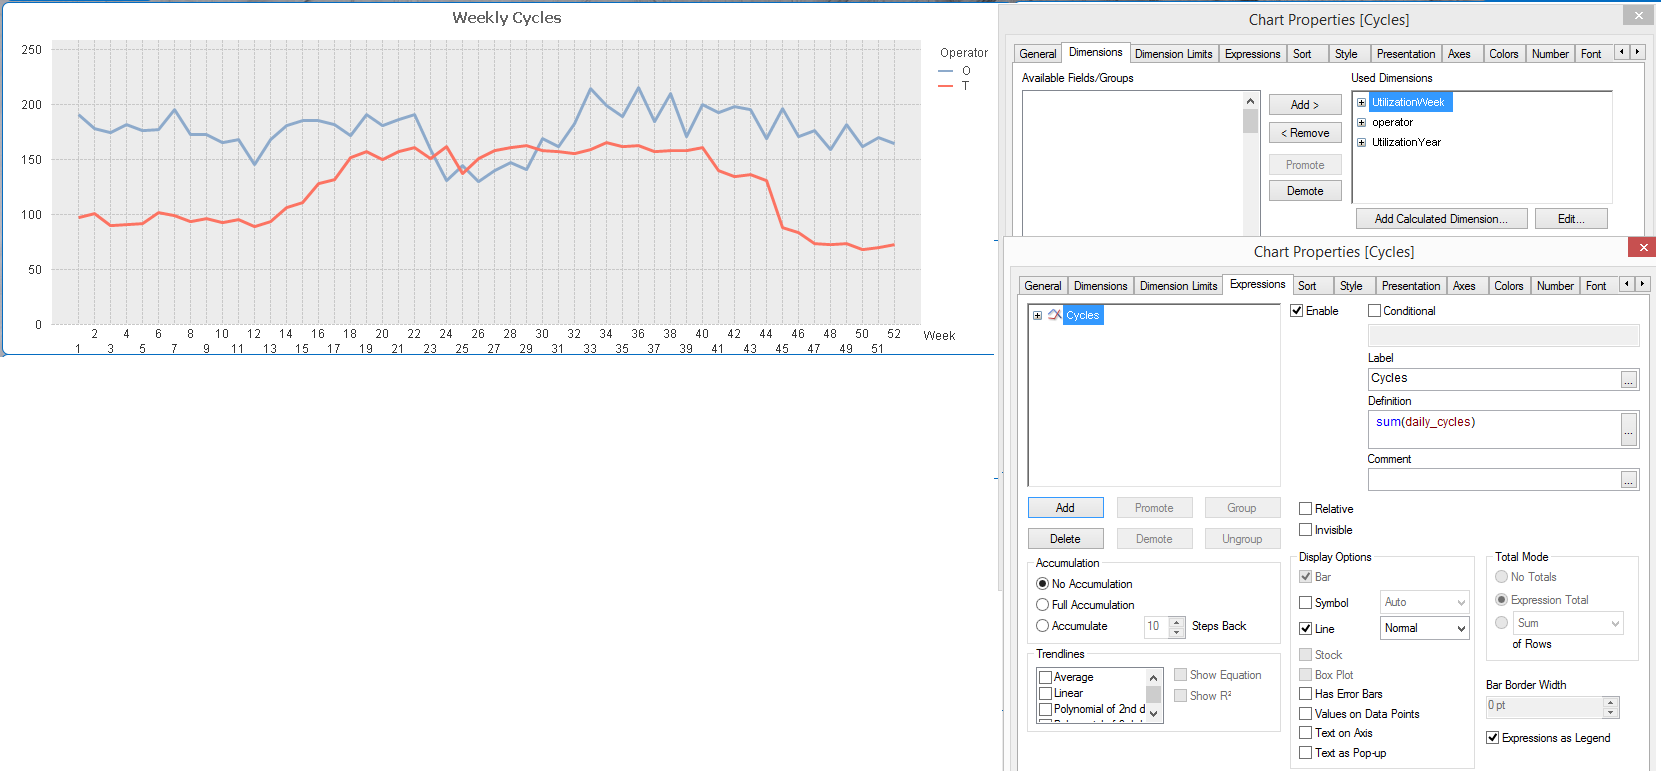
I've been playing arround with this chart, in which I now want to create an average line based on the blue and red line. Or on Operator dimension in general. If I would have 3 operators selected, then give the average line of those 3 operators.
I know how to create a straight average line, but I want it to vary with every week. So the average should be based on the expresion.
Should I define this line by adding a new expression? If so how do I do this?
Regards, looking forward to some tips!
Accepted Solutions
- Mark as New
- Bookmark
- Subscribe
- Mute
- Subscribe to RSS Feed
- Permalink
- Report Inappropriate Content
Use only UtilizationWeek as dimension and three expressions:
- O: sum({<operator={'O'}>}daily_cycles)
- T: sum({<operator={'T'}>}daily_cycles)
- Average: rangeavg(sum({<operator={'O'}>}daily_cycles),sum({<operator={'T'}>}daily_cycles))
talk is cheap, supply exceeds demand
- Mark as New
- Bookmark
- Subscribe
- Mute
- Subscribe to RSS Feed
- Permalink
- Report Inappropriate Content
Hi,
Remove Operator Dimension and add 3 expressions below
For Operator O : Sum({<operator={'O'}>} daily_cycles)
For Operator T : Sum({<operator={'O'}>} daily_cycles)
For Average of O & T : =Rangesum(Column(1) + Column(2))/2
Hope this helps you.
Regards,
Jagan.
- Mark as New
- Bookmark
- Subscribe
- Mute
- Subscribe to RSS Feed
- Permalink
- Report Inappropriate Content
Your input, both seem to work very nicely! This is exactly what I was looking for!
However is it possible in QlikView to also make make the expression act in a dynamic way. What I'm trying to say, This newly defined expression is fixed to the specified operator.
If I would select another operator in the list box, the graph will still show the specified operators O and T. That is why I put the operator in dimension.
The addon Im looking for is something like:
- =If(GetCurrentField(operator) = 'O', Sum({<operator={'O'}>} daily_cycles))
(this expresion however does not work)
In words, the expression should: Generate a line based on the selected operator AND should match operator O. So if no operator 'O' is selected it just doesn't show a line. If this is possible I would now be able to make different selections for operators in a listbox, while using the same graph which just changes based on the selected operators.
I this case I should make this expression for every operator available, which is ok. Is this possible?
- Mark as New
- Bookmark
- Subscribe
- Mute
- Subscribe to RSS Feed
- Permalink
- Report Inappropriate Content
Try
- =If(GetFieldSelections(operator) = 'O', Sum({<operator={'O'}>} daily_cycles))
Regards,
Jagan.