Unlock a world of possibilities! Login now and discover the exclusive benefits awaiting you.
- Qlik Community
- :
- All Forums
- :
- QlikView App Dev
- :
- Day Chart / Activity Tracking
- Subscribe to RSS Feed
- Mark Topic as New
- Mark Topic as Read
- Float this Topic for Current User
- Bookmark
- Subscribe
- Mute
- Printer Friendly Page
- Mark as New
- Bookmark
- Subscribe
- Mute
- Subscribe to RSS Feed
- Permalink
- Report Inappropriate Content
Day Chart / Activity Tracking
Hey Everyone,
I've been searching through the community to figure this out, but haven't been able to find exactly what I'm looking for. Essentially, for my guys, we have a set schedule as to what their activities should be; i.e. login at 9, work on cases till 11, training till 2, work on cases till 5, log out.
We also have them track their current activities through a phone logging system which reflects their status.What I'm looking to create, is some kind of visual representation of their day. Ideally it would look something like the below:
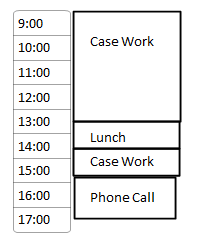
(Sorry that it's a bit crude) Hopefully, what it will display is the exact time that the agent starts an activity while representing what time of day it is overall. It also won't group the categories together into one lump amount, but rather recognize that they are separate entries throughout the day. As for the data itself, it would be repesented in the following way:
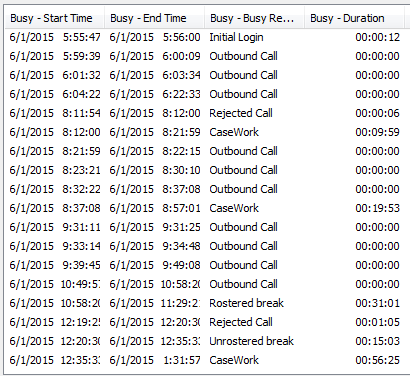
(There would also be an Agent field)
Has anyone put together something like this already, or has someone already asked for this type of thing in the community that I could be linked to?
My apologies if I haven't formatted the request correctly or included the right information for it as this is my first time posting.
Any and all help is greatly appreciated! Thanks all!
- John
Accepted Solutions
- Mark as New
- Bookmark
- Subscribe
- Mute
- Subscribe to RSS Feed
- Permalink
- Report Inappropriate Content
Sounds like a Gantt chart might work for you: Files for creation of a Gantt chart
talk is cheap, supply exceeds demand
- Mark as New
- Bookmark
- Subscribe
- Mute
- Subscribe to RSS Feed
- Permalink
- Report Inappropriate Content
Sounds like a Gantt chart might work for you: Files for creation of a Gantt chart
talk is cheap, supply exceeds demand
- Mark as New
- Bookmark
- Subscribe
- Mute
- Subscribe to RSS Feed
- Permalink
- Report Inappropriate Content
That is exactly what I need! Thank you!!
The only issue I'm encountering is getting the duration field between the two timestamps.
In the article linked, it references adding the duration as an expression: Max(EndDate)-Min(StartDate).
In this case, my dates are always going to be the same, while the time of day is going to be different.
I've tried shortening the Start dates and end dates into just the time of day using:
TimeStamp#(trim(subfield(@21,' ',2)),'hh:mm:ss') as [Busy - Start Time],
TimeStamp#(trim(subfield(@22,' ',2)),'hh:mm:ss') as [Busy - End Time],
and then I'm trying to calculate the duration between them with the following:
Max(Timestamp#([Busy - End Time]))-Min(Timestamp#([Busy - Start Time]))
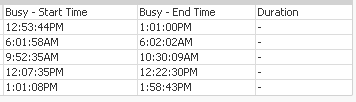
However the results keep coming back as Null:
I've also tried using:
Timestamp(Max(Timestamp#([Busy - End Time]))-Min(Timestamp#([Busy - Start Time])))
[Busy - End Time]-[Busy - Start Time]
Interval([Busy - End Time]-[Busy - Start Time])
Interval(Max(Timestamp#([Busy - End Time]))-Min(Timestamp#([Busy - Start Time])))
I know my calculation for the duration is probably way off, but that seems to be the final part that's really holding me up. I do already have the duration field which does tell me the time difference, but it seems like when I am plotting it, I need to be able to reference the Min(Busy - Start Time) so that it plots it correctly.
Sorry, since your initial response, I've been banging my head against the wall trying to get that last little part to work.
Thanks again so much!
- Mark as New
- Bookmark
- Subscribe
- Mute
- Subscribe to RSS Feed
- Permalink
- Report Inappropriate Content
I think your time values are still text values and not numbers. The time format you used in the timestamp# function doesn't seem correct. The values in the screenshot have h:mm:ssTT as format, not hh:mm:ss. I reckon that you should see results when you use that h:mm:ssTT format in your load script and reload the document.
talk is cheap, supply exceeds demand
- Mark as New
- Bookmark
- Subscribe
- Mute
- Subscribe to RSS Feed
- Permalink
- Report Inappropriate Content
You were bang on the money. Thank you so much!