Unlock a world of possibilities! Login now and discover the exclusive benefits awaiting you.
- Qlik Community
- :
- All Forums
- :
- QlikView App Dev
- :
- Re: linechart trend
- Subscribe to RSS Feed
- Mark Topic as New
- Mark Topic as Read
- Float this Topic for Current User
- Bookmark
- Subscribe
- Mute
- Printer Friendly Page
- Mark as New
- Bookmark
- Subscribe
- Mute
- Subscribe to RSS Feed
- Permalink
- Report Inappropriate Content
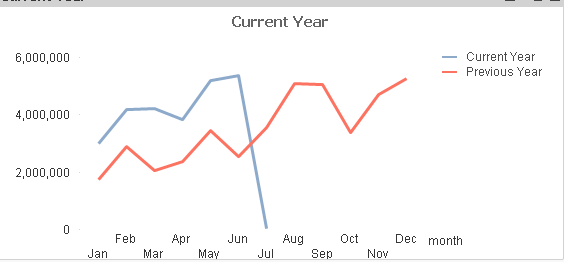
linechart trend
Hi all,
In a line chart,
I'm using Month and Year as dimensions and COunt(Distinct()) function in expression.
I'm was trying to get the trend for 2014 and 2015 one above the other. But, my years were seperated and eventually consuming more space on the front end.
Can someone look into this.
Please find the screenshot for current trend.
Accepted Solutions
- Mark as New
- Bookmark
- Subscribe
- Mute
- Subscribe to RSS Feed
- Permalink
- Report Inappropriate Content
the month-year values are different hence the lines are not merging..
share the sample qvw.
- Mark as New
- Bookmark
- Subscribe
- Mute
- Subscribe to RSS Feed
- Permalink
- Report Inappropriate Content
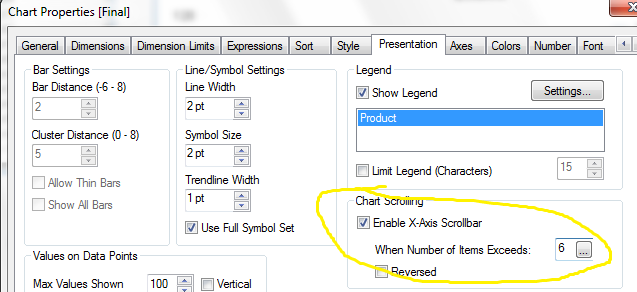 you can use a scroll bar.
- Mark as New
- Bookmark
- Subscribe
- Mute
- Subscribe to RSS Feed
- Permalink
- Report Inappropriate Content
Hi Krishna Chaitanya,
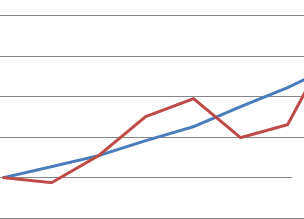
Im looking for a chart something like:
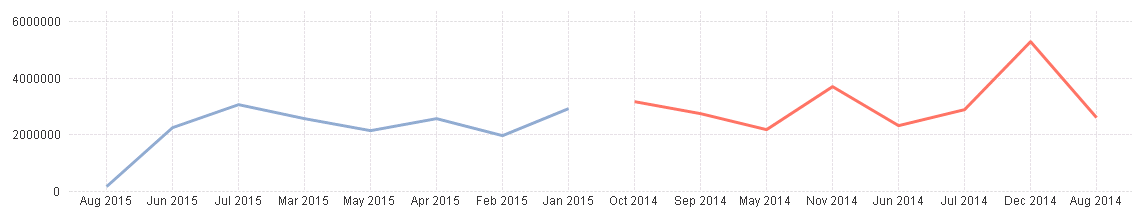
but my chart is seperated with trends like:
- Mark as New
- Bookmark
- Subscribe
- Mute
- Subscribe to RSS Feed
- Permalink
- Report Inappropriate Content
Use 2 Dimensions (Month and Year) and 1 Expression : Count()
- Mark as New
- Bookmark
- Subscribe
- Mute
- Subscribe to RSS Feed
- Permalink
- Report Inappropriate Content
the month-year values are different hence the lines are not merging..
share the sample qvw.
- Mark as New
- Bookmark
- Subscribe
- Mute
- Subscribe to RSS Feed
- Permalink
- Report Inappropriate Content
Thanq Krishna Chaitanya,
I will load them with same month name seperated by year.
Thanq verymuch.
- Mark as New
- Bookmark
- Subscribe
- Mute
- Subscribe to RSS Feed
- Permalink
- Report Inappropriate Content
Thanq Antonio.
- Mark as New
- Bookmark
- Subscribe
- Mute
- Subscribe to RSS Feed
- Permalink
- Report Inappropriate Content
You Welcome.
You can try something like this:
Put these in your chat
Dimension : Month or Year
Expressions : Sum({<year={$(=max(year))}>}field) //for current year
Sum({<year={$(=max(year)-1)}>}field) //for previous year
output: