Unlock a world of possibilities! Login now and discover the exclusive benefits awaiting you.
- Qlik Community
- :
- All Forums
- :
- QlikView App Dev
- :
- Re: scatter chart dot size
Options
- Subscribe to RSS Feed
- Mark Topic as New
- Mark Topic as Read
- Float this Topic for Current User
- Bookmark
- Subscribe
- Mute
- Printer Friendly Page
Turn on suggestions
Auto-suggest helps you quickly narrow down your search results by suggesting possible matches as you type.
Showing results for
Not applicable
2015-08-06
05:26 AM
- Mark as New
- Bookmark
- Subscribe
- Mute
- Subscribe to RSS Feed
- Permalink
- Report Inappropriate Content
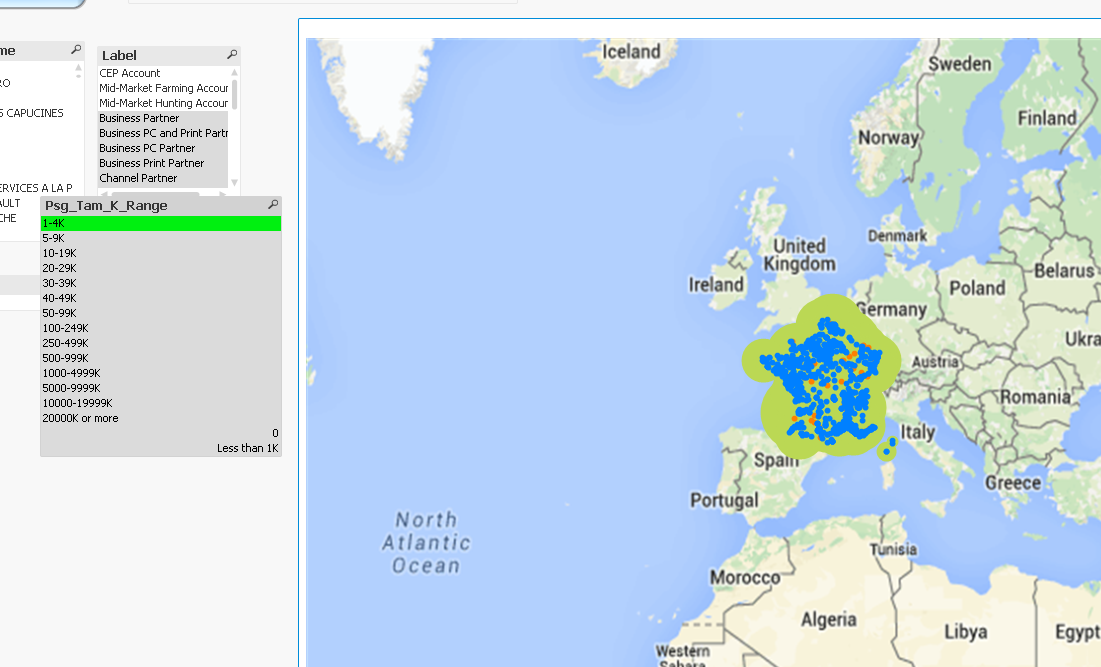
scatter chart
Hi
i have a scatter chart with map .
2,378 Views
- « Previous Replies
-
- 1
- 2
- Next Replies »
12 Replies
Not applicable
2015-08-06
07:57 AM
Author
- Mark as New
- Bookmark
- Subscribe
- Mute
- Subscribe to RSS Feed
- Permalink
- Report Inappropriate Content
 Hi jagan
thanks for the app but i found a small cocnern with this approach!!!
if i select lower range value also still i can see bigger dots. Could you please suggest me?
153 Views
Not applicable
2015-08-06
08:02 AM
Author
- Mark as New
- Bookmark
- Subscribe
- Mute
- Subscribe to RSS Feed
- Permalink
- Report Inappropriate Content
Steve thanks for the time and app, but i was expecting app related to bubble size variation.
153 Views
Anonymous
Not applicable
2015-08-06
09:33 AM
Author
- Mark as New
- Bookmark
- Subscribe
- Mute
- Subscribe to RSS Feed
- Permalink
- Report Inappropriate Content
You might want to look a little closer. The bubble sizes vary. You can adjust this via the Bubble size parameter on the Presentation tab.
153 Views
- « Previous Replies
-
- 1
- 2
- Next Replies »