Unlock a world of possibilities! Login now and discover the exclusive benefits awaiting you.
- Qlik Community
- :
- All Forums
- :
- QlikView App Dev
- :
- Re: List Box for just one chart
- Subscribe to RSS Feed
- Mark Topic as New
- Mark Topic as Read
- Float this Topic for Current User
- Bookmark
- Subscribe
- Mute
- Printer Friendly Page
- Mark as New
- Bookmark
- Subscribe
- Mute
- Subscribe to RSS Feed
- Permalink
- Report Inappropriate Content
List Box for just one chart
Good afternoon mates,
I did 2 charts, one month by month, 2 years, and another just by stores. I have a list box for products, who change both charts.
No problem, but now, I want a list box, just to change the Store Chart, cuz I'll put months, in other words, I'll have a chart for stock month by month of all the enterprise, and another chart, changing by the list box, just the months I want to see the stock by store.
- Mark as New
- Bookmark
- Subscribe
- Mute
- Subscribe to RSS Feed
- Permalink
- Report Inappropriate Content
You can use alternate states for that purpose:
- Mark as New
- Bookmark
- Subscribe
- Mute
- Subscribe to RSS Feed
- Permalink
- Report Inappropriate Content
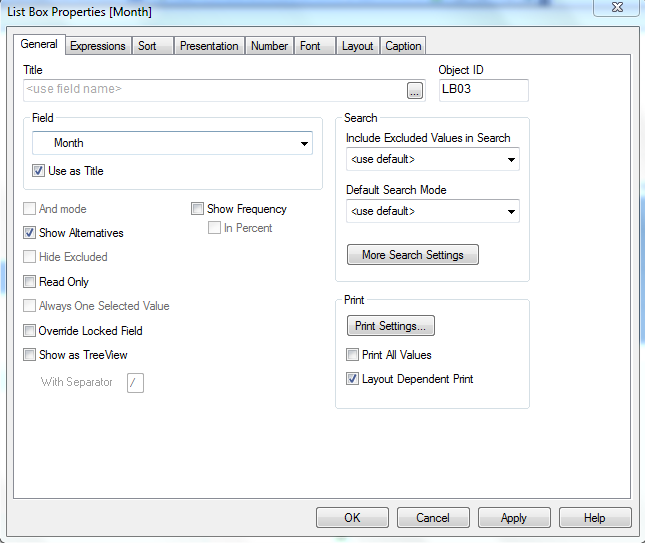
The chart which we should not change based on a selection of Month in your expression:
{<Month = >}
- Mark as New
- Bookmark
- Subscribe
- Mute
- Subscribe to RSS Feed
- Permalink
- Report Inappropriate Content
I didn't find "Alternate States" on mine:
- Mark as New
- Bookmark
- Subscribe
- Mute
- Subscribe to RSS Feed
- Permalink
- Report Inappropriate Content
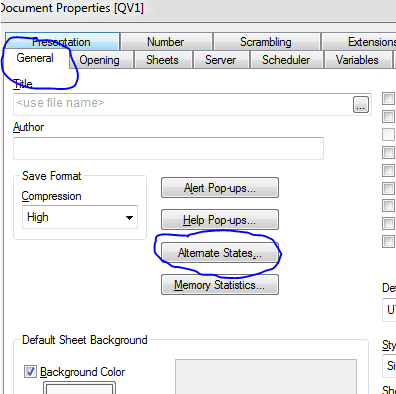
You first need to create it by going to document properties:
- Mark as New
- Bookmark
- Subscribe
- Mute
- Subscribe to RSS Feed
- Permalink
- Report Inappropriate Content
I didn't understand so well, and I guess it didn't solve my problem. I heard something about links, like we do with slicers on excel.
- Mark as New
- Bookmark
- Subscribe
- Mute
- Subscribe to RSS Feed
- Permalink
- Report Inappropriate Content
You can watch this 6 minutes tutorial:
QlikView | Set Analysis | Alternate States or Comparative Analysis - YouTube
- Mark as New
- Bookmark
- Subscribe
- Mute
- Subscribe to RSS Feed
- Permalink
- Report Inappropriate Content
Hi!
I added an example , it might help.