Unlock a world of possibilities! Login now and discover the exclusive benefits awaiting you.
- Qlik Community
- :
- All Forums
- :
- QlikView App Dev
- :
- Re: How to create a relationship matrix for displa...
- Subscribe to RSS Feed
- Mark Topic as New
- Mark Topic as Read
- Float this Topic for Current User
- Bookmark
- Subscribe
- Mute
- Printer Friendly Page
- Mark as New
- Bookmark
- Subscribe
- Mute
- Subscribe to RSS Feed
- Permalink
- Report Inappropriate Content
How to create a relationship matrix for displaying in Qliksense?
Hello,
I tried to search this one but could not find a previous question with
reply.
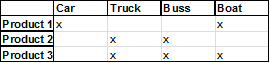
I have created a matrix with dependencies between products and where they
are used (example below).
1: Now I like to display this dependencies in Qliksense so one can see in
which types of vehicle a product is use or vice versa. I also like to be able
to select more than one product and see where they are used or more than one
vehicle and see what products are used.
2: In a second step I like then link whatever combination selected in (1)
and see sales values for that product or vehicle type.
My problem is that I have not find a good way how to visualize this and/or
there is a smarter way to create the relationship matrix.
Any tips and advice is appreciated on chart types and/or how to structure
the data matrix.
Many thanks in advance
- Mark as New
- Bookmark
- Subscribe
- Mute
- Subscribe to RSS Feed
- Permalink
- Report Inappropriate Content
Forgot the picture of example