Unlock a world of possibilities! Login now and discover the exclusive benefits awaiting you.
- Qlik Community
- :
- All Forums
- :
- QlikView App Dev
- :
- Re: Scatter Chart Bubble Relative to Saving
- Subscribe to RSS Feed
- Mark Topic as New
- Mark Topic as Read
- Float this Topic for Current User
- Bookmark
- Subscribe
- Mute
- Printer Friendly Page
- Mark as New
- Bookmark
- Subscribe
- Mute
- Subscribe to RSS Feed
- Permalink
- Report Inappropriate Content
Scatter Chart Bubble Relative to Saving
Hi All
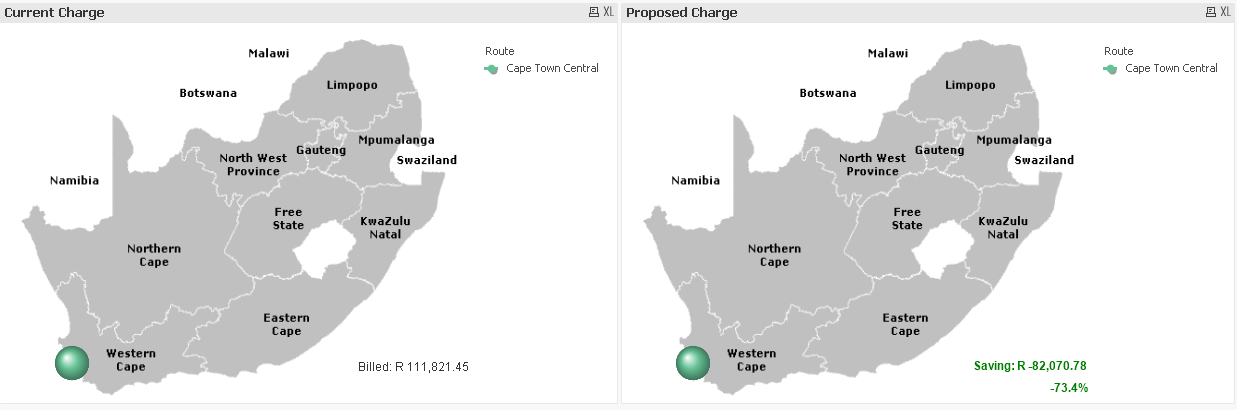
I have two columns of Values (Spend and Potential Spend). I have plotted these over a map. How do I show a bubble which should be proportionately smaller is the spend is smaller? See example below/attached
City Spend Potential Spend
A 111,821.45 29,751.00
How do get the right hand map showing a much smaller bubble as the spend is 3.75 x less?
- Mark as New
- Bookmark
- Subscribe
- Mute
- Subscribe to RSS Feed
- Permalink
- Report Inappropriate Content
Hi,
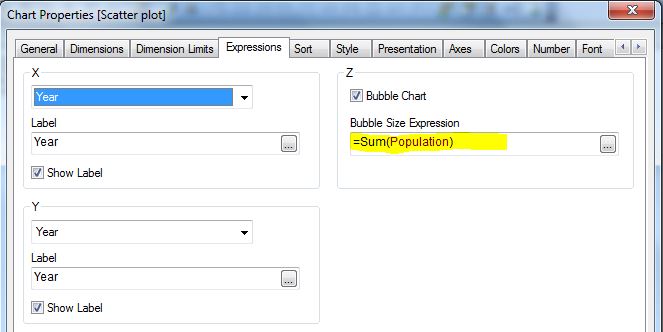
Did you try the Third (Z) Expression for Bubble Size?
- Mark as New
- Bookmark
- Subscribe
- Mute
- Subscribe to RSS Feed
- Permalink
- Report Inappropriate Content
Hi Settu
I un-ticked 'Advanced' and saw your expression screen.
The problem is, the ;left chart expression Sum([Charge]) and the right chart expression Sum([Actual Charge]) are relative to themselves so the size of the bubble does not change. What I need is for the right hand chart expression to be 3.75x smaller than the left hand chart as the Sum([Charge]) = $111,000 and the Sum([Actual Charge]) = $29,751
- Mark as New
- Bookmark
- Subscribe
- Mute
- Subscribe to RSS Feed
- Permalink
- Report Inappropriate Content
Hi,
I'm not sure about the exact size, but you can try this expression in the Bubble size Sum([Charge])/3.75
I think you want the bubble size only right side graph..
- Mark as New
- Bookmark
- Subscribe
- Mute
- Subscribe to RSS Feed
- Permalink
- Report Inappropriate Content
Hi Bruce,
I'm afraid there is no way to it. Each chart has own relative scale for bubbles.
The only workaround I can see here - to add technical falue (via script) to each value of both your dimensions, lets say max number, it will be on both charts. Then make this bubble transparent using conditional colour. Still not a good way.