Unlock a world of possibilities! Login now and discover the exclusive benefits awaiting you.
- Qlik Community
- :
- All Forums
- :
- QlikView App Dev
- :
- Re: Line Chart Color Coding Issue
- Subscribe to RSS Feed
- Mark Topic as New
- Mark Topic as Read
- Float this Topic for Current User
- Bookmark
- Subscribe
- Mute
- Printer Friendly Page
- Mark as New
- Bookmark
- Subscribe
- Mute
- Subscribe to RSS Feed
- Permalink
- Report Inappropriate Content
Line Chart Color Coding Issue
Hi Team,
I've line chart(Added Circle as Symbol) with 'Year' as Dimension and 'Sum(Sales)' as Measure . when I selected one year it displays last four years data.My requirement is selected year sales are less than previous year it has to show Red color for that year line as shown in image. Issue is the end of the line chart also display red if the line is red but it displays as green. Color code is given in Expression tab->Background color as
=if(yearend(max([Year1]),-1)=yearend(max([Year]),-2) ,
if(
$(Sales_YTD)-$(Sales_PrevYTD)>0,
RGB(0,176,80), RGB(192,0,0)),
RGB(0,176,80)
)
Please any one help me for resolving this issue.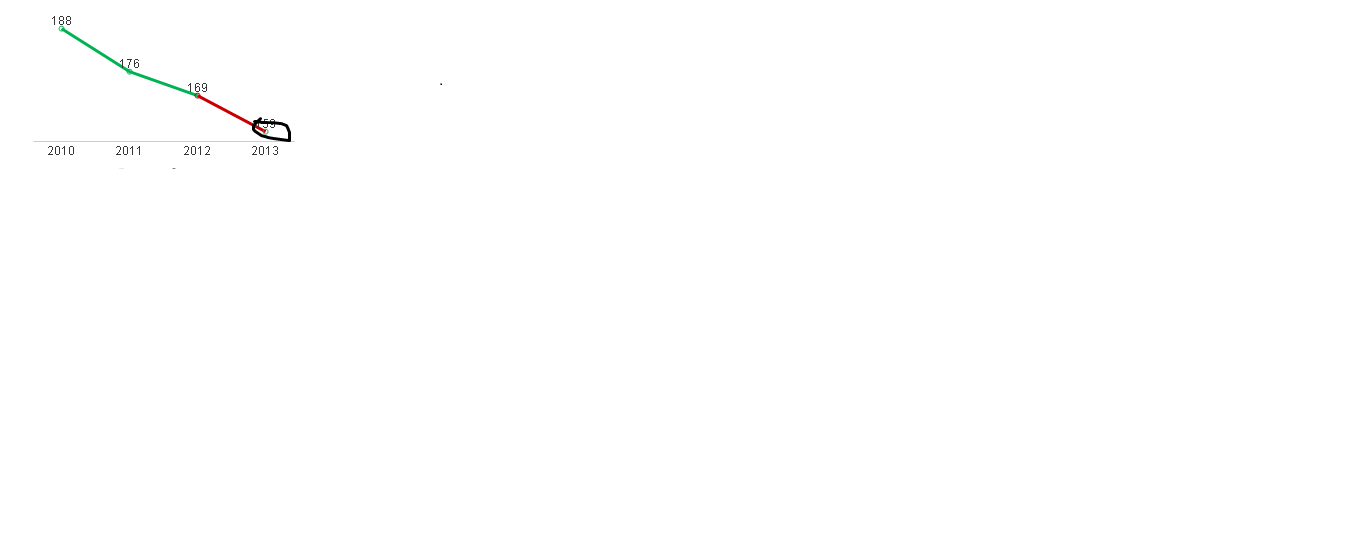
- Mark as New
- Bookmark
- Subscribe
- Mute
- Subscribe to RSS Feed
- Permalink
- Report Inappropriate Content
Did you mean your expression to refer to Year1 and Year? Or is that just a typo.
I suggest that you post your application or a representative sample to get more accurate and useful help.
- Mark as New
- Bookmark
- Subscribe
- Mute
- Subscribe to RSS Feed
- Permalink
- Report Inappropriate Content
Year1 and Year
- Mark as New
- Bookmark
- Subscribe
- Mute
- Subscribe to RSS Feed
- Permalink
- Report Inappropriate Content
Hmm - is that a yes or a no? There are two separate fields? Post your model or sample please.
- Mark as New
- Bookmark
- Subscribe
- Mute
- Subscribe to RSS Feed
- Permalink
- Report Inappropriate Content
Yes I've year1 and year fields.
Thank you Jonathan Dienst for your quick response .I got the solution for this.