Unlock a world of possibilities! Login now and discover the exclusive benefits awaiting you.
- Qlik Community
- :
- All Forums
- :
- QlikView App Dev
- :
- Re: Bar Chart with No Dimensions and Multiple Expr...
- Subscribe to RSS Feed
- Mark Topic as New
- Mark Topic as Read
- Float this Topic for Current User
- Bookmark
- Subscribe
- Mute
- Printer Friendly Page
- Mark as New
- Bookmark
- Subscribe
- Mute
- Subscribe to RSS Feed
- Permalink
- Report Inappropriate Content
Bar Chart with No Dimensions and Multiple Expressions
Good Afternoon -
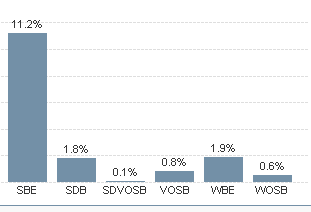
I have a simple bar chart with no dimensions and multiple expressions (as my data is in different columns) and I'm trying to figure out how to not only show the actual value but include an industry benchmark. Much appreciate any help!!!!
This is what I have
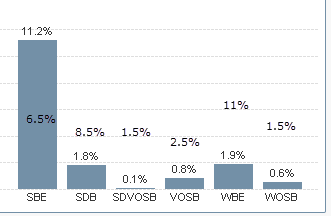
This what I want
- Mark as New
- Bookmark
- Subscribe
- Mute
- Subscribe to RSS Feed
- Permalink
- Report Inappropriate Content
Connect the standard values(as Excel or Inline) to data through dimension or date .Then you can easily plot the standard values.If you can't connect to data other option is add calculated expression ex:if (Dimesion='SBE','6.5%') and display it as text as popup.Downside is you won't see number in chart until you hover over each bar.
- Mark as New
- Bookmark
- Subscribe
- Mute
- Subscribe to RSS Feed
- Permalink
- Report Inappropriate Content
Post a sample app or data
- Mark as New
- Bookmark
- Subscribe
- Mute
- Subscribe to RSS Feed
- Permalink
- Report Inappropriate Content
Here you go....I'm looking to have Standard_A displayed within the A bar, and so on.
- Mark as New
- Bookmark
- Subscribe
- Mute
- Subscribe to RSS Feed
- Permalink
- Report Inappropriate Content
I used Inline table
- Mark as New
- Bookmark
- Subscribe
- Mute
- Subscribe to RSS Feed
- Permalink
- Report Inappropriate Content
How would you do in without Inline as my data in the graph is made up of 15 different expressions
- Mark as New
- Bookmark
- Subscribe
- Mute
- Subscribe to RSS Feed
- Permalink
- Report Inappropriate Content
Inline is similar to your excel file I added Standards to respective Fields(A,B,C,D) instead of variables.If you post real sample application with 15 expressions then I can look into.
- Mark as New
- Bookmark
- Subscribe
- Mute
- Subscribe to RSS Feed
- Permalink
- Report Inappropriate Content
Thx Chai - appreciate the time and help. I've found an alternative to displaying the benchmarks but will try to post something as soon as I can as I know this will come up again for me.
- Mark as New
- Bookmark
- Subscribe
- Mute
- Subscribe to RSS Feed
- Permalink
- Report Inappropriate Content
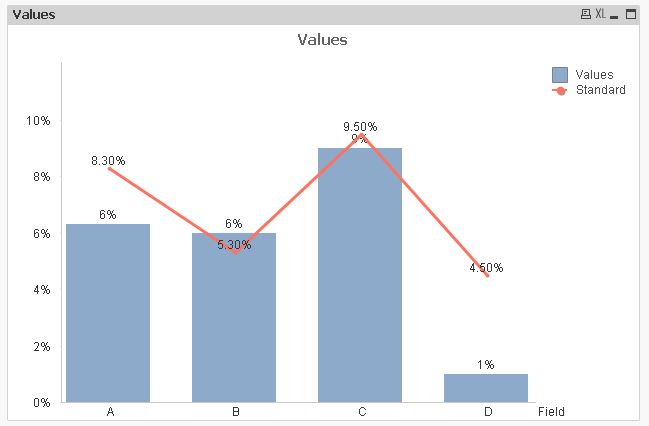
I got the wrong graph in app.The bar chart will look like this
- Mark as New
- Bookmark
- Subscribe
- Mute
- Subscribe to RSS Feed
- Permalink
- Report Inappropriate Content
Hi ,
As suggested use combo chart and make the line expression as invisible in the expressions tab then you won't get the line.
Hope it helps .
KK
- Mark as New
- Bookmark
- Subscribe
- Mute
- Subscribe to RSS Feed
- Permalink
- Report Inappropriate Content
Thanks KK - how ever a combo chart is not going to work as I do not have any Dimensions and 15 expressions representing 15 different results.