Unlock a world of possibilities! Login now and discover the exclusive benefits awaiting you.
- Qlik Community
- :
- All Forums
- :
- QlikView App Dev
- :
- Re: Bar graph, bar formation question.
- Subscribe to RSS Feed
- Mark Topic as New
- Mark Topic as Read
- Float this Topic for Current User
- Bookmark
- Subscribe
- Mute
- Printer Friendly Page
- Mark as New
- Bookmark
- Subscribe
- Mute
- Subscribe to RSS Feed
- Permalink
- Report Inappropriate Content
Bar graph, bar formation question.
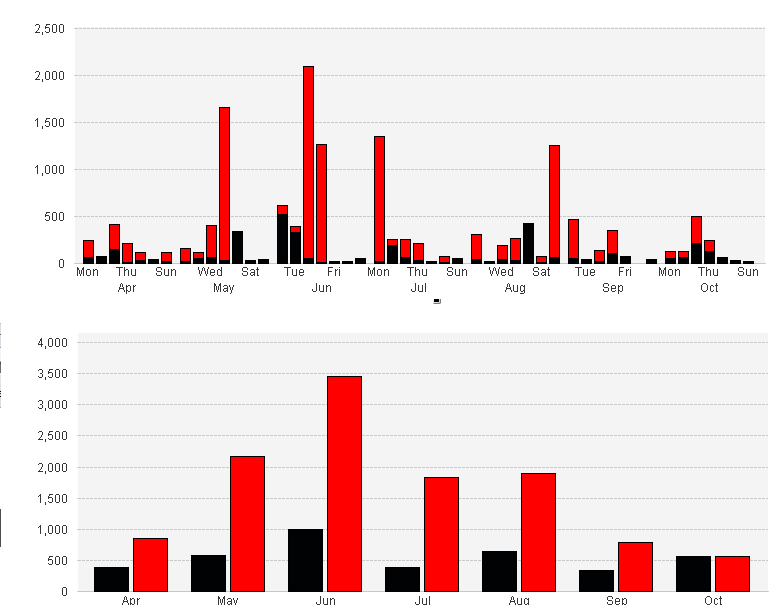
Hi guys, the following question regarding bar charts. In the example below you can see two different graphs, in the first one I define a bar for the WeekDays of months. Now what I want is the propety of the last bar chart. I want the red and black bar next to each other.
But in the first graph they are stacked, I do not want that.
But I cannot get it right, any suggestions?
Dimensions:
1) TaskPerfWeekDay
2) =if(match(TaskPerfMonth,'Apr','May','Jun','Jul','Aug','Sep','Oct'), TaskPerfMonth)
- « Previous Replies
-
- 1
- 2
- Next Replies »
- Mark as New
- Bookmark
- Subscribe
- Mute
- Subscribe to RSS Feed
- Permalink
- Report Inappropriate Content
Hi,
Check this out, in case your 3rd dimension is stacked up. Seems like this is the way QV works..
- Mark as New
- Bookmark
- Subscribe
- Mute
- Subscribe to RSS Feed
- Permalink
- Report Inappropriate Content
Im not quite getting my desired result. Does anyone have a suggestion how to merge either the dimension or the expresions to one expresion/dimension?
DIMENSIONS:
1) TaskPerfWeekDay
2) =if(match(TaskPerfMonth,'Apr','May','Jun','Jul','Aug','Sep','Oct'), TaskPerfMonth)
EXPRESIONS:
1) =Sum({<operator={'AAA'}>} aggr(sum(total_hours),ac_registr,TaskPerfDay, TaskPerfMonth))/24
2) Sum({<operator={'BBB'}>} aggr(sum(total_hours),ac_registr,TaskPerfDay, TaskPerfMonth))/24
the bars should be grouped on the operator code AAA and BBB.
- « Previous Replies
-
- 1
- 2
- Next Replies »