Unlock a world of possibilities! Login now and discover the exclusive benefits awaiting you.
- Qlik Community
- :
- All Forums
- :
- QlikView App Dev
- :
- Re: Bar Chart with No Dimensions and Multiple Expr...
- Subscribe to RSS Feed
- Mark Topic as New
- Mark Topic as Read
- Float this Topic for Current User
- Bookmark
- Subscribe
- Mute
- Printer Friendly Page
- Mark as New
- Bookmark
- Subscribe
- Mute
- Subscribe to RSS Feed
- Permalink
- Report Inappropriate Content
Bar Chart with No Dimensions and Multiple Expressions
Good Afternoon -
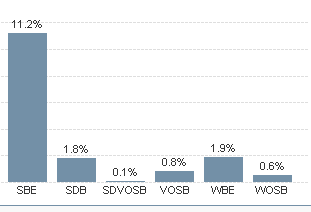
I have a simple bar chart with no dimensions and multiple expressions (as my data is in different columns) and I'm trying to figure out how to not only show the actual value but include an industry benchmark. Much appreciate any help!!!!
This is what I have
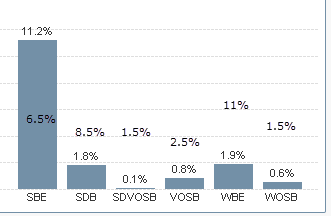
This what I want
- « Previous Replies
- Next Replies »
- Mark as New
- Bookmark
- Subscribe
- Mute
- Subscribe to RSS Feed
- Permalink
- Report Inappropriate Content
I know you are working on another way of showing Standards.Create a dummy Dimesion and tie it back to your expressions and standards.I Hope you find solution.
Thanks
- Mark as New
- Bookmark
- Subscribe
- Mute
- Subscribe to RSS Feed
- Permalink
- Report Inappropriate Content
Hi,
Please find the attached app. Is this your requirement ??? Just i'm displaying two values in bar chart.Let me know for further assistance.
- Mark as New
- Bookmark
- Subscribe
- Mute
- Subscribe to RSS Feed
- Permalink
- Report Inappropriate Content
That's perfect...how did you do that? I'm looking at your app but how do you do it please?
- Mark as New
- Bookmark
- Subscribe
- Mute
- Subscribe to RSS Feed
- Permalink
- Report Inappropriate Content
Looks like in his app he is using two bar charts one on top of other with second chart showing only standards (transaprent with only values) and other chart with real values.
- Mark as New
- Bookmark
- Subscribe
- Mute
- Subscribe to RSS Feed
- Permalink
- Report Inappropriate Content
Ah - thanks. That's why the values don't line up on the Y axis....not sure that's going to work.
Thanks Chaiperi for the help -
- Mark as New
- Bookmark
- Subscribe
- Mute
- Subscribe to RSS Feed
- Permalink
- Report Inappropriate Content
Krishna20 - thx but overlapping two graphs is not going to work as the Y Axis values are out of alignment.
- Mark as New
- Bookmark
- Subscribe
- Mute
- Subscribe to RSS Feed
- Permalink
- Report Inappropriate Content
Hi ,
Yes, I have used two bar charts.when some things not happened by actual visualisation. We need to play in different ways with charts.If its perfect and chooses to your requirement you can use this method.
- « Previous Replies
- Next Replies »