Unlock a world of possibilities! Login now and discover the exclusive benefits awaiting you.
- Qlik Community
- :
- All Forums
- :
- QlikView App Dev
- :
- Re: Labels on Chart with Subtype = Stacked
- Subscribe to RSS Feed
- Mark Topic as New
- Mark Topic as Read
- Float this Topic for Current User
- Bookmark
- Subscribe
- Mute
- Printer Friendly Page
- Mark as New
- Bookmark
- Subscribe
- Mute
- Subscribe to RSS Feed
- Permalink
- Report Inappropriate Content
Labels on Chart with Subtype = Stacked
Hi,
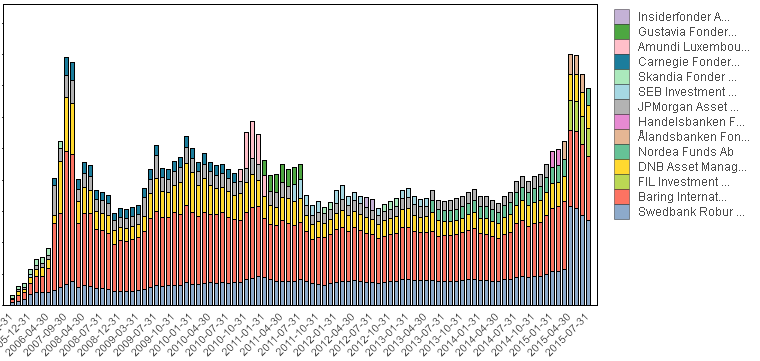
I have a problem with labels on a chart, I want the label to the right to show only the most recent entery in this chart (2015-07-31 in chart below). Now, this shows a mix of enteries that have been represented in the past.
How can I achieve this?
Thanks
Daniel
- « Previous Replies
-
- 1
- 2
- Next Replies »
- Mark as New
- Bookmark
- Subscribe
- Mute
- Subscribe to RSS Feed
- Permalink
- Report Inappropriate Content
Can you post a small qlikview document that demonstrates the problem?
talk is cheap, supply exceeds demand
- Mark as New
- Bookmark
- Subscribe
- Mute
- Subscribe to RSS Feed
- Permalink
- Report Inappropriate Content
Are you referring to the legend on the right when you say labels?
- Mark as New
- Bookmark
- Subscribe
- Mute
- Subscribe to RSS Feed
- Permalink
- Report Inappropriate Content
Are you saying you want to limit the values on the legend to only reflect values for the date 2015-07-31? I'd imagine if you were going to do that you'd also want to limit the the bars themselves to only represent the data for that date otherwise you will have segments of bar that the user will not be able to identify. You could probably restrict these values with some type of if statement in your legend... Maybe something like =if([Your Date Dimension] >= date(date#('2015-07-31', 'YYYY-MM-DD'),'YYYY-MM-DD'), [Your Date Dimension])
- Mark as New
- Bookmark
- Subscribe
- Mute
- Subscribe to RSS Feed
- Permalink
- Report Inappropriate Content
Adam, Yes it is.
Gysbert,see attachment in this post.
- Mark as New
- Bookmark
- Subscribe
- Mute
- Subscribe to RSS Feed
- Permalink
- Report Inappropriate Content
Yes I want the values on the legend to only reflect values shown for the latest date (2015-07-31 in pic). But I still want to see the history to be able to see the changes through time.
- Mark as New
- Bookmark
- Subscribe
- Mute
- Subscribe to RSS Feed
- Permalink
- Report Inappropriate Content
the options I can think of to try are
combo chart, where one expression is for the latest date and the other expressions show trend - maybe bar for latest date and line for trend - only have the expression for legend be checked for the expression for latest date
2 seperate charts - one for trend history and one for latest date - put them side by side
- Mark as New
- Bookmark
- Subscribe
- Mute
- Subscribe to RSS Feed
- Permalink
- Report Inappropriate Content
try below expression
SUM({<EE={'Asia'}, Date={"$(=date(max(Date)))"}>}AUM)
- Mark as New
- Bookmark
- Subscribe
- Mute
- Subscribe to RSS Feed
- Permalink
- Report Inappropriate Content
Daniel, see attached...
I don't believe you will be able to limit the legend without in turn limiting the data returned. My proposed solution is to have 2 calculated dimension and a button the switches between showing the current and showing the history.
- Mark as New
- Bookmark
- Subscribe
- Mute
- Subscribe to RSS Feed
- Permalink
- Report Inappropriate Content
see attached - I have it in 2 charts but you should be able to make a combo chart with the second expression as a variable with max date (I hard coded just for testing
- « Previous Replies
-
- 1
- 2
- Next Replies »