Unlock a world of possibilities! Login now and discover the exclusive benefits awaiting you.
- Qlik Community
- :
- Forums
- :
- Analytics
- :
- New to Qlik Analytics
- :
- Re: How to create a Pie Chart in Qlik Sense?
- Subscribe to RSS Feed
- Mark Topic as New
- Mark Topic as Read
- Float this Topic for Current User
- Bookmark
- Subscribe
- Mute
- Printer Friendly Page
- Mark as New
- Bookmark
- Subscribe
- Mute
- Subscribe to RSS Feed
- Permalink
- Report Inappropriate Content
How to create a Pie Chart in Qlik Sense?
Hi there,
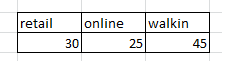
I would like to create a pie chart in qlik sense. Currently i am having such data as below, as i have column retail, online,walkin, and the amount of it.
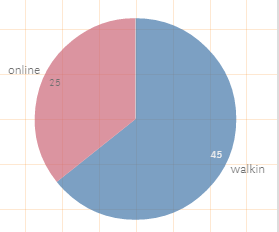
So, question is, how can i put such data into a pie chart in qlik sense? in the pic chart, should see is divided into retail, online, walkin.
Rgds,
Jim
- « Previous Replies
-
- 1
- 2
- Next Replies »
- Mark as New
- Bookmark
- Subscribe
- Mute
- Subscribe to RSS Feed
- Permalink
- Report Inappropriate Content
So, how can i achieve that kind of pie chart?
- Mark as New
- Bookmark
- Subscribe
- Mute
- Subscribe to RSS Feed
- Permalink
- Report Inappropriate Content
Hi,
You need to use CrossTable table operator and convert the columns in rows. I assume you have some identifier apart from these columns? Something like this:
CrossTable(SaleType, Sale, 1)
load * inline
[
retail,online,walkin
30,25,45
];
Cheers,
DV
- Mark as New
- Bookmark
- Subscribe
- Mute
- Subscribe to RSS Feed
- Permalink
- Report Inappropriate Content
Hi
Use cross table in the meaning to cross your 3 différents fields as value into a new created dimension.
Then use in your pie chart this new dimension
Regards
Bruno
- Mark as New
- Bookmark
- Subscribe
- Mute
- Subscribe to RSS Feed
- Permalink
- Report Inappropriate Content
I have tried your method. But i only managed to get 2 dimension to show out - online and walkin. But retail, not showing.
- Mark as New
- Bookmark
- Subscribe
- Mute
- Subscribe to RSS Feed
- Permalink
- Report Inappropriate Content
Yes, if you read my previous message. I did mention that you must have some unique ID in your data model? Please can you post all the fields in your model?
- Mark as New
- Bookmark
- Subscribe
- Mute
- Subscribe to RSS Feed
- Permalink
- Report Inappropriate Content
Nope. really i dont have any unique ID. and i only have this table.
- Mark as New
- Bookmark
- Subscribe
- Mute
- Subscribe to RSS Feed
- Permalink
- Report Inappropriate Content
Never mind! Create a unique ID yourself. If it's just INLINE table as you show above then something like this would do the trick:
CrossTable(SaleType, Sale, 1)
load * inline
[
MyID, retail,online,walkin
1,30,25,45
];
However, if you have more rows then you can create a unique ID using RowNo() function.
Hope this helps!
Cheers,
DV
- Mark as New
- Bookmark
- Subscribe
- Mute
- Subscribe to RSS Feed
- Permalink
- Report Inappropriate Content
Also, see my video tutorial to understand more about CrossTable operator:
http://qlikshare.com/qlikview-video-tutorial-crosstable-qlikview-transpose-data/
Good luck!
Cheers,
DV
- Mark as New
- Bookmark
- Subscribe
- Mute
- Subscribe to RSS Feed
- Permalink
- Report Inappropriate Content
Yeah, finally did it. but why do we need a unique ID in a crosstable ?
- Mark as New
- Bookmark
- Subscribe
- Mute
- Subscribe to RSS Feed
- Permalink
- Report Inappropriate Content
where shoud i insert the RowNo() ??
CrossTable(category, amount,RowNo()) ?
This time around i am not using in line. is real excel data, but there's no number of ID for each line. can i use RowNo?
- « Previous Replies
-
- 1
- 2
- Next Replies »