Unlock a world of possibilities! Login now and discover the exclusive benefits awaiting you.
- Qlik Community
- :
- Forums
- :
- Analytics
- :
- New to Qlik Analytics
- :
- Re: Linechart change colour
- Subscribe to RSS Feed
- Mark Topic as New
- Mark Topic as Read
- Float this Topic for Current User
- Bookmark
- Subscribe
- Mute
- Printer Friendly Page
- Mark as New
- Bookmark
- Subscribe
- Mute
- Subscribe to RSS Feed
- Permalink
- Report Inappropriate Content
Linechart change colour
Hi again,
I have now created a line chart and I want to use specific colours for the lines. I see it's possible to add colours, but how do I do it? I want one line to be green and another red for example? Where can I find the codes for colours and how do I add it in the fx?
Thanks
- Tags:
- colour expression
- « Previous Replies
-
- 1
- 2
- Next Replies »
- Mark as New
- Bookmark
- Subscribe
- Mute
- Subscribe to RSS Feed
- Permalink
- Report Inappropriate Content
As far as I know it's not yet possible to set the color for each individual measure.
talk is cheap, supply exceeds demand
- Mark as New
- Bookmark
- Subscribe
- Mute
- Subscribe to RSS Feed
- Permalink
- Report Inappropriate Content
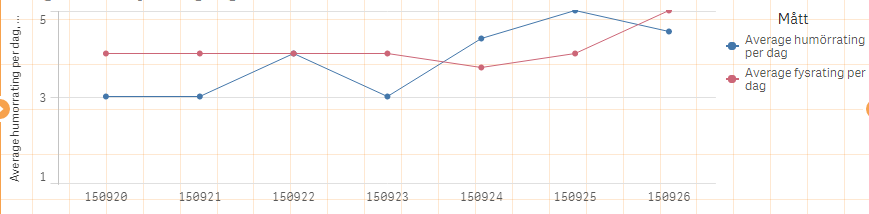
In the line chart, you must have a Dimension (cannot be a Master Item) in order to change the colors.
In the color property, select custom > by expression and adjust the below formula to work for your needs.
if([Customer]='Paracel',Green(),Red())
returns:

Please mark the reply as correct or helpful if it suits your needs
- Mark as New
- Bookmark
- Subscribe
- Mute
- Subscribe to RSS Feed
- Permalink
- Report Inappropriate Content
yes you can change the colour.
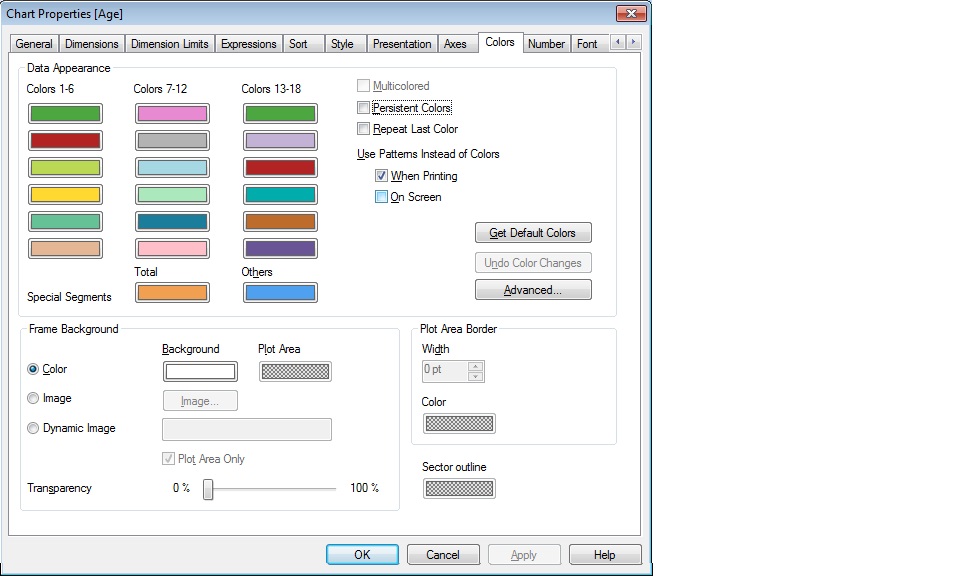
Change colour 1-6 and colour 7-12 as per your requirement.

attached is the qvw
- Mark as New
- Bookmark
- Subscribe
- Mute
- Subscribe to RSS Feed
- Permalink
- Report Inappropriate Content
Qlik Sense, not QlikView 
talk is cheap, supply exceeds demand
- Mark as New
- Bookmark
- Subscribe
- Mute
- Subscribe to RSS Feed
- Permalink
- Report Inappropriate Content
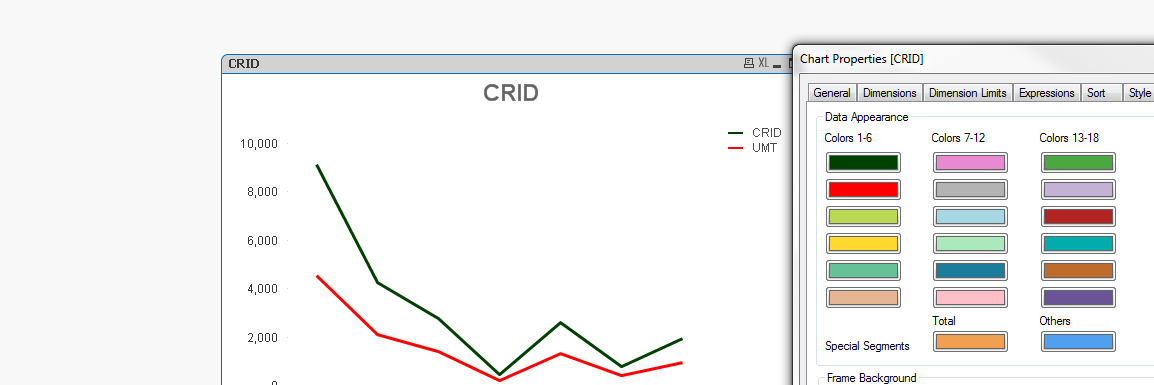
Yes. Its possible to change line color as per requirement in Qlikview 11. You need to select color tab & then in color tab select color as you required. In the below screen shot I have selected green color for first expression & red color for second expression.
- Mark as New
- Bookmark
- Subscribe
- Mute
- Subscribe to RSS Feed
- Permalink
- Report Inappropriate Content
sorry..my mistake..:)
- Mark as New
- Bookmark
- Subscribe
- Mute
- Subscribe to RSS Feed
- Permalink
- Report Inappropriate Content
QlikSense not QliVview...
- Mark as New
- Bookmark
- Subscribe
- Mute
- Subscribe to RSS Feed
- Permalink
- Report Inappropriate Content
 sorry ...
- Mark as New
- Bookmark
- Subscribe
- Mute
- Subscribe to RSS Feed
- Permalink
- Report Inappropriate Content
Thank you for your help. Plannig on learning Qlik View as well so good to know that it's possible there.
- « Previous Replies
-
- 1
- 2
- Next Replies »