Unlock a world of possibilities! Login now and discover the exclusive benefits awaiting you.
- Qlik Community
- :
- All Forums
- :
- QlikView App Dev
- :
- Exceltable in Qlik-View with all data for selectio...
- Subscribe to RSS Feed
- Mark Topic as New
- Mark Topic as Read
- Float this Topic for Current User
- Bookmark
- Subscribe
- Mute
- Printer Friendly Page
- Mark as New
- Bookmark
- Subscribe
- Mute
- Subscribe to RSS Feed
- Permalink
- Report Inappropriate Content
Exceltable in Qlik-View with all data for selection
Hello all,
I hope this is the right area for my question!?
I startet working with Qlik-View this week and here is my first problem 🙂
Structure of my Qlik-View project
Page1: Data selection
Page2: Diagramms and calculations
On page1 I want to have a Table (it should preferably look like the Original Exceltabel) were i can chose the data i want to transfer to the next calculations on page2. My main problem on this stage is the table, I can´t implement a table witch show me all the information i have in the Excelsheet... and so i can´t select the data i need for page2. If i make several tabels for each colum of the table it would probably work but in this way its very hard to order the data in the right way ore even select the right data.
I hope you understand my problem and can help me with it 🙂
Greetings V.Fischer
Accepted Solutions
- Mark as New
- Bookmark
- Subscribe
- Mute
- Subscribe to RSS Feed
- Permalink
- Report Inappropriate Content
Hi Vicent,
Have you tried to creat a Table Box with every field you have? It's a aproximated solution for your problem! 
Like this:
Miguel
- Mark as New
- Bookmark
- Subscribe
- Mute
- Subscribe to RSS Feed
- Permalink
- Report Inappropriate Content
Hi Vicent,
Have you tried to creat a Table Box with every field you have? It's a aproximated solution for your problem!
Like this:
Miguel
- Mark as New
- Bookmark
- Subscribe
- Mute
- Subscribe to RSS Feed
- Permalink
- Report Inappropriate Content
Hi,
Thank you Miguel! The table is exactly what I want, I think I was blind that I didn´t see this easy way for my problem 
I hope you can help me with my next one too...
My next problem is that i can choos just on datapoint for the next page, i need something like a checkbox were i can say "i want all Materials from my Table exkluding this 3-4 Materials because they were Build in an other Department"
I want to calculate a % value and here i need the count of all Materials and then the count of all checked Materials from the big List  (this score i want to present on page 2 of my projekt)
Thanks a lot for your help!
Greetings V.Fischer
- Mark as New
- Bookmark
- Subscribe
- Mute
- Subscribe to RSS Feed
- Permalink
- Report Inappropriate Content
It is much easier for you to get help if you have a sample Excel-file with data and graphics very close to what you are trying to achieve. It can be mock-up data if your data is sensitive. It is easy in QlikView to generate data anyway...
- Mark as New
- Bookmark
- Subscribe
- Mute
- Subscribe to RSS Feed
- Permalink
- Report Inappropriate Content
Hi Vicent,
You need to create a field where you specified from what department a Material was built like this:
if(ID_Material = '1000', 'Department1', 'Department2') as TypeOfMaterials
If you do this you can add a listbox with all possible Materials from a specific Department. Then you just need to go to the Presentation and change Selection Sylte Override to LED Check boxes to make the apearance to a checkbox like you want.
If you want the percentage you need to do a set analysis expression that perhaps should look like this:
=count({$< TypeOfMaterials = 'Department1'>} ID_Materials)/count(ID_Materials)
Please tell me if I helped you, and if my first answer is correct mark it as the corrected one.
- Mark as New
- Bookmark
- Subscribe
- Mute
- Subscribe to RSS Feed
- Permalink
- Report Inappropriate Content
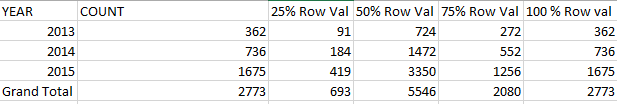
Is this something you can use for your help ? I´m sorry but i cant upload the real tabel, this one is randomised but the Headlines are nearly right (just translated )
)

What i want to do is: we have 6 Rows, 5 of them are good, 1is Bad so we have ~83% passed the qualitycontrol
- Mark as New
- Bookmark
- Subscribe
- Mute
- Subscribe to RSS Feed
- Permalink
- Report Inappropriate Content
What do you mean with "field" ? A field in the tabel ore a calculatingfield somewhere on page1 ?
- Mark as New
- Bookmark
- Subscribe
- Mute
- Subscribe to RSS Feed
- Permalink
- Report Inappropriate Content
I'll analysis this table and give you an answer when finished 
- Mark as New
- Bookmark
- Subscribe
- Mute
- Subscribe to RSS Feed
- Permalink
- Report Inappropriate Content
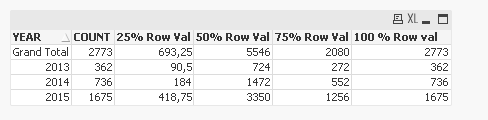
Here see the attached files.
Hope it helps