Unlock a world of possibilities! Login now and discover the exclusive benefits awaiting you.
- Qlik Community
- :
- All Forums
- :
- QlikView App Dev
- :
- Re: Scenario to display sales data in between year...
- Subscribe to RSS Feed
- Mark Topic as New
- Mark Topic as Read
- Float this Topic for Current User
- Bookmark
- Subscribe
- Mute
- Printer Friendly Page
- Mark as New
- Bookmark
- Subscribe
- Mute
- Subscribe to RSS Feed
- Permalink
- Report Inappropriate Content
Scenario to display sales data in between years using set analysis.
Recently I attended an interview. Below is one of the questions asked. Could any one please help me with the answer.
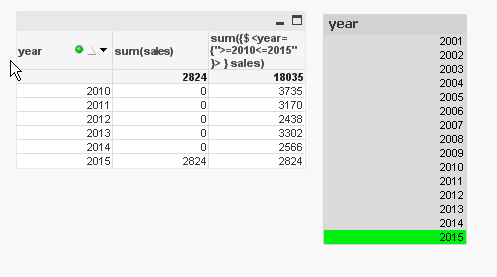
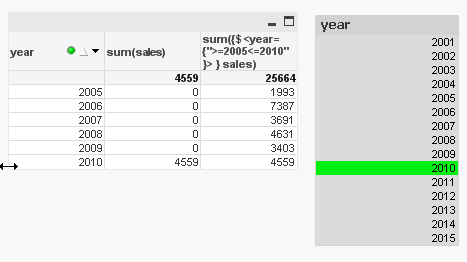
Suppose we have sales data for years from 2001 to 2015. If I select year 2015, the chart should display sales data for years 2010 to 2015. Similarly, If I select year 2010, the chart should display sales data for years 2005 to 2010.
How can you do that using set analysis ?
- Tags:
- qlikview_scripting
- Mark as New
- Bookmark
- Subscribe
- Mute
- Subscribe to RSS Feed
- Permalink
- Report Inappropriate Content
you ca use a chart with year as dimension and this expression
sum({$ <year={">=$(=max(year)-5)<=$(=max(year))"}> } sales)
- Mark as New
- Bookmark
- Subscribe
- Mute
- Subscribe to RSS Feed
- Permalink
- Report Inappropriate Content
Thanks Maxgro.
I believe max(year) is identical to year. Please correct me if I am wrong.
Do you think the above expression gives correct results if I select year as 2010 ?
Thanks,
Chowdary
- Mark as New
- Bookmark
- Subscribe
- Mute
- Subscribe to RSS Feed
- Permalink
- Report Inappropriate Content
small example in the attachment
- Mark as New
- Bookmark
- Subscribe
- Mute
- Subscribe to RSS Feed
- Permalink
- Report Inappropriate Content
Thanks maxgro.
It works
- Mark as New
- Bookmark
- Subscribe
- Mute
- Subscribe to RSS Feed
- Permalink
- Report Inappropriate Content
please close the thread