Unlock a world of possibilities! Login now and discover the exclusive benefits awaiting you.
- Qlik Community
- :
- Forums
- :
- Analytics
- :
- New to Qlik Analytics
- :
- Re: How to SUM a range of date?
- Subscribe to RSS Feed
- Mark Topic as New
- Mark Topic as Read
- Float this Topic for Current User
- Bookmark
- Subscribe
- Mute
- Printer Friendly Page
- Mark as New
- Bookmark
- Subscribe
- Mute
- Subscribe to RSS Feed
- Permalink
- Report Inappropriate Content
How to SUM a range of date?
Hello,
I am trying to créate a report of Discount Sales using Qlik Sense.
How can I add up a specified range of date?
Example in file.
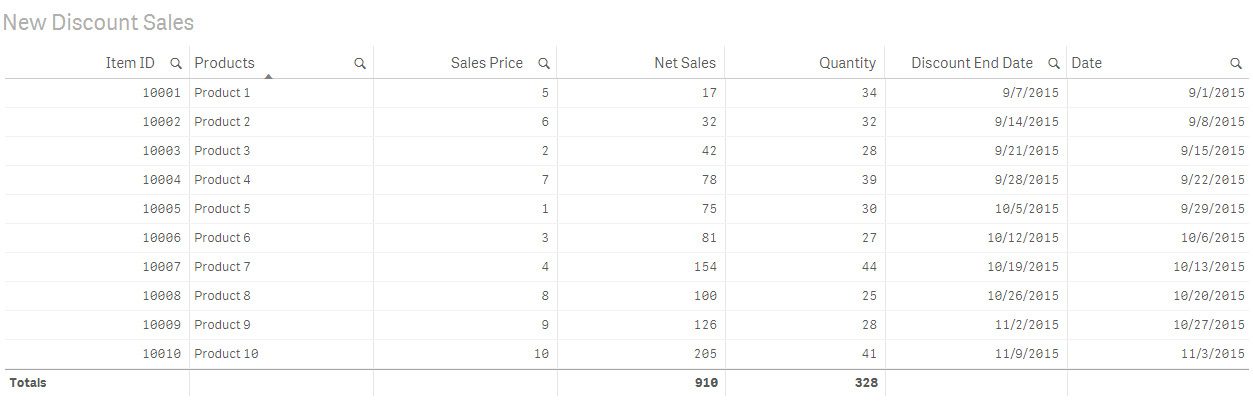
Once you open file with Qlik Sense, you will see the following columns:
Date / Ítem ID / Products / Discount End Date / SalePrice / DiscPrice / Quantity / NetSales
I want to add or sum all Quantity and NetSales between the Date and Discount End Date of the Sales Date.
For Example:
Product 1 of Ítem ID 10001, the Discount Date runs from Sept 1st to Sept 7th, if I add up all the sales total from that range gives me $17.00 from 34 unit sold.
But if I just want to see the discount date, I uncheck the Show null values from Discount End Date, and this gives me one line data. and the Total need to be $17 and 34 Quantity, but this shows me 1 unit which is $.50 cents
I attached the App
- Tags:
- sum range date
- « Previous Replies
-
- 1
- 2
- Next Replies »
Accepted Solutions
- Mark as New
- Bookmark
- Subscribe
- Mute
- Subscribe to RSS Feed
- Permalink
- Report Inappropriate Content
Hi Daniel,
The below was your original data model:
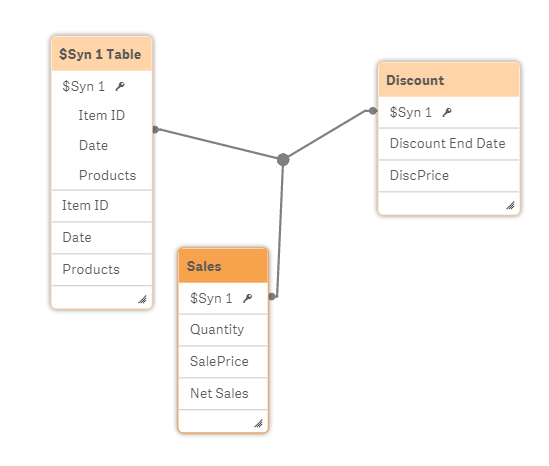
The syn table occurs when there are multiple joins or circular references:
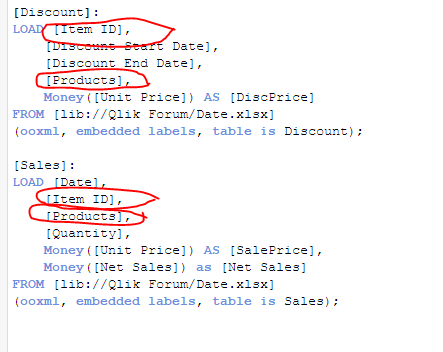
As you can see you had Item ID and Products in both Discount and Sales table. Also the discount table was really a reference table which had date ranges for different products. In this case, I used IntervalMatch() function to find the appropriate discounts for products that had the same date range.
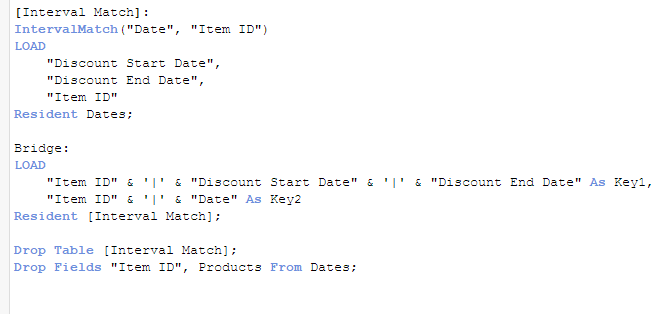
IntervalMatch() function helped to create the bridge table to connect Discount and Sales by using date ranges and Products:
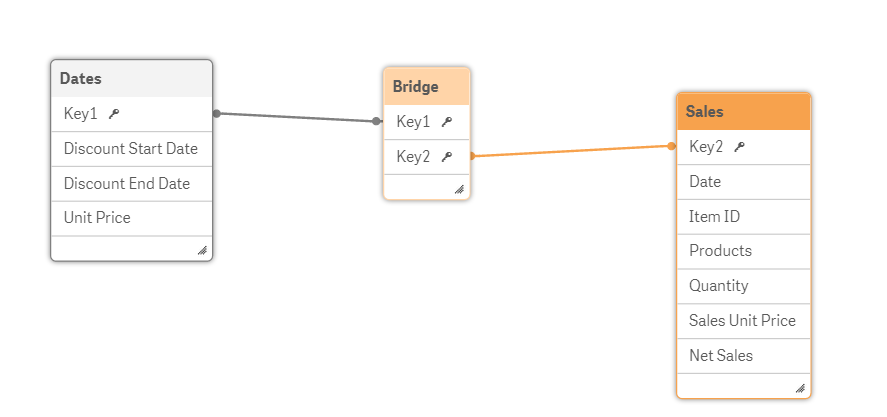
In the load script, I also dropped the two common fields of Item ID and Products from Dates table:
and renamed the unit price field in Sales table to sales unit price to avoid the syn table or any other circular references.
Finally, in the front-end table, I used Aggr() function to aggregate Net Sales, Quantity, and Date fields to get one record per product view. You can check the functions and use of dimensions within Aggr() functions:
If this helps, please close the thread by choosing one of the answers as correct or helpful.
Thanks
- Mark as New
- Bookmark
- Subscribe
- Mute
- Subscribe to RSS Feed
- Permalink
- Report Inappropriate Content
Hi,
You have some data modelling issues. Can you post the excel files here as well?
Thanks
- Mark as New
- Bookmark
- Subscribe
- Mute
- Subscribe to RSS Feed
- Permalink
- Report Inappropriate Content
Hi Sinan,
This is the file example. Not sure what you mean with Data Modeling issue.
thanks
- Mark as New
- Bookmark
- Subscribe
- Mute
- Subscribe to RSS Feed
- Permalink
- Report Inappropriate Content
Is this what you are looking for?
I am attaching the qvf.
Hope this helps.
Thanks
- Mark as New
- Bookmark
- Subscribe
- Mute
- Subscribe to RSS Feed
- Permalink
- Report Inappropriate Content
Hi Sinan,
This is really helpful. Sincé I am new with Qlik, can you explain me what exactly I did wrong or how did you do it?
Regards.
Daniel
- Mark as New
- Bookmark
- Subscribe
- Mute
- Subscribe to RSS Feed
- Permalink
- Report Inappropriate Content
Hi Daniel,
The below was your original data model:
The syn table occurs when there are multiple joins or circular references:
As you can see you had Item ID and Products in both Discount and Sales table. Also the discount table was really a reference table which had date ranges for different products. In this case, I used IntervalMatch() function to find the appropriate discounts for products that had the same date range.
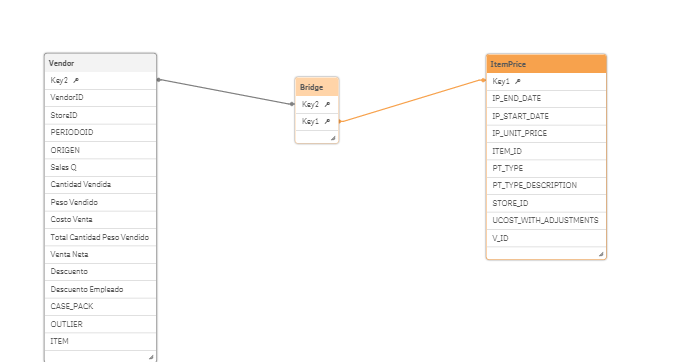
IntervalMatch() function helped to create the bridge table to connect Discount and Sales by using date ranges and Products:
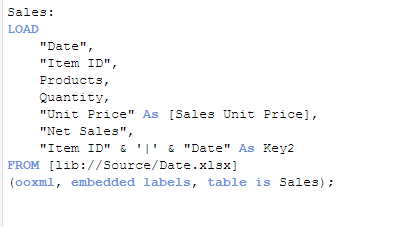
In the load script, I also dropped the two common fields of Item ID and Products from Dates table:
and renamed the unit price field in Sales table to sales unit price to avoid the syn table or any other circular references.
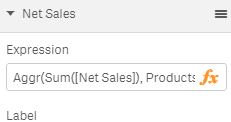
Finally, in the front-end table, I used Aggr() function to aggregate Net Sales, Quantity, and Date fields to get one record per product view. You can check the functions and use of dimensions within Aggr() functions:
If this helps, please close the thread by choosing one of the answers as correct or helpful.
Thanks
- Mark as New
- Bookmark
- Subscribe
- Mute
- Subscribe to RSS Feed
- Permalink
- Report Inappropriate Content
Hi Sinan,
I am trying this on another QlikSense App and don't know what I'm doing wrong.
I attached the Excel File with the column name that is in use, I just created the rows.
trying to apply the same thing that you teached me, but not working for me, when I come to this informations.
Thanks for your help
Regards,
- Mark as New
- Bookmark
- Subscribe
- Mute
- Subscribe to RSS Feed
- Permalink
- Report Inappropriate Content
Thanks for your help before, but I am encountering the same problem.
I have attached the qvf and the Excel file.
I tried to do the Interval Match, but don't really know how it Works.
I did this, and say that field doesn't exist.
hope you can help me
Thanks in advance for your help
[Interval Match]:
IntervalMatch(num([PeriodoReal]),[ITEM_ID])
LOAD
[IP_START_DATE],
[IP_END_DATE],
[ITEM_ID]
Resident [ItemPrice];
Bridge:
LOAD
[ITEM_ID] & '|' & [IP_START_DATE] & '|' & [IP_END_DATE] As Key1,
[ITEM_ID] & '|' & num(date#([PERIODOID],'YYYYMMDD')) As Key2
Resident [Interval Match];
Drop Table [Interval Match];
Drop Fields "Item ID", [DESCRIPTION_PRODUCT] From Dates;
- Mark as New
- Bookmark
- Subscribe
- Mute
- Subscribe to RSS Feed
- Permalink
- Report Inappropriate Content
Hi Daniel,
I will take a look at it.
Thanks
- Mark as New
- Bookmark
- Subscribe
- Mute
- Subscribe to RSS Feed
- Permalink
- Report Inappropriate Content
Hi Daniel,
Sorry for the late reply. I only brought two tables for the simplicity sake:
Take a look at the attached qvf and let me know if it works for you.
- « Previous Replies
-
- 1
- 2
- Next Replies »