Unlock a world of possibilities! Login now and discover the exclusive benefits awaiting you.
- Qlik Community
- :
- Forums
- :
- Analytics
- :
- New to Qlik Analytics
- :
- Re: Doubt to create Graphic Comb Qlik Sense
Options
- Subscribe to RSS Feed
- Mark Topic as New
- Mark Topic as Read
- Float this Topic for Current User
- Bookmark
- Subscribe
- Mute
- Printer Friendly Page
Turn on suggestions
Auto-suggest helps you quickly narrow down your search results by suggesting possible matches as you type.
Showing results for
Contributor III
2015-10-17
10:15 AM
- Mark as New
- Bookmark
- Subscribe
- Mute
- Subscribe to RSS Feed
- Permalink
- Report Inappropriate Content
Doubt to create Graphic Comb Qlik Sense
Hello guys,
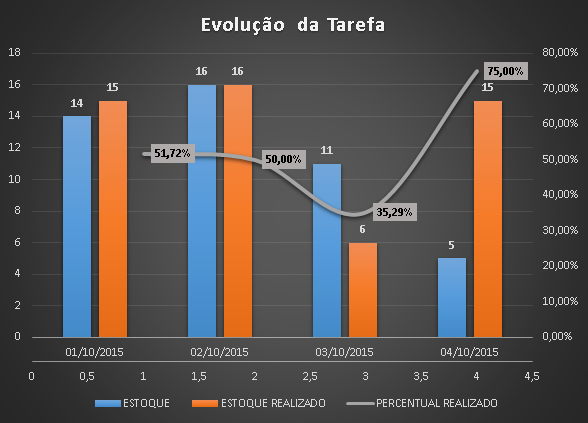
I'm new user Qlik Sense and am having trouble creating a combination chart with the following data:
| STATUS | DTFOTO | QUANTIDADE |
| ESTOQUE | 01/10/2015 | 14 |
| ESTOQUE REALIZADO | 01/10/2015 | 15 |
| ESTOQUE | 02/10/2015 | 16 |
| ESTOQUE REALIZADO | 02/10/2015 | 16 |
| ESTOQUE | 03/10/2015 | 11 |
| ESTOQUE REALIZADO | 03/10/2015 | 6 |
| ESTOQUE | 04/10/2015 | 5 |
| ESTOQUE REALIZADO | 04/10/2015 | 15 |
From the data above have:
Dimensions:
> stock
> Held
> DtFoto
values:
> Quantity
> percentage
I must look like this:
Could anyone help me?
319 Views
1 Reply
Master III
2015-10-17
04:50 PM
- Mark as New
- Bookmark
- Subscribe
- Mute
- Subscribe to RSS Feed
- Permalink
- Report Inappropriate Content
And at the moment you can not show value labels in Combo Chart so you will not be able to recreate this chart.
Check Qlik branch - maybe any of available extension will help you
http://branch.qlik.com/projects/forumdisplay.php?6-Projects&sort=dateline&order=desc
178 Views
Community Browser