Unlock a world of possibilities! Login now and discover the exclusive benefits awaiting you.
- Qlik Community
- :
- All Forums
- :
- QlikView App Dev
- :
- "Plot Values Inside Segments" in Mekko Chart
- Subscribe to RSS Feed
- Mark Topic as New
- Mark Topic as Read
- Float this Topic for Current User
- Bookmark
- Subscribe
- Mute
- Printer Friendly Page
- Mark as New
- Bookmark
- Subscribe
- Mute
- Subscribe to RSS Feed
- Permalink
- Report Inappropriate Content
"Plot Values Inside Segments" in Mekko Chart
Hi, All.
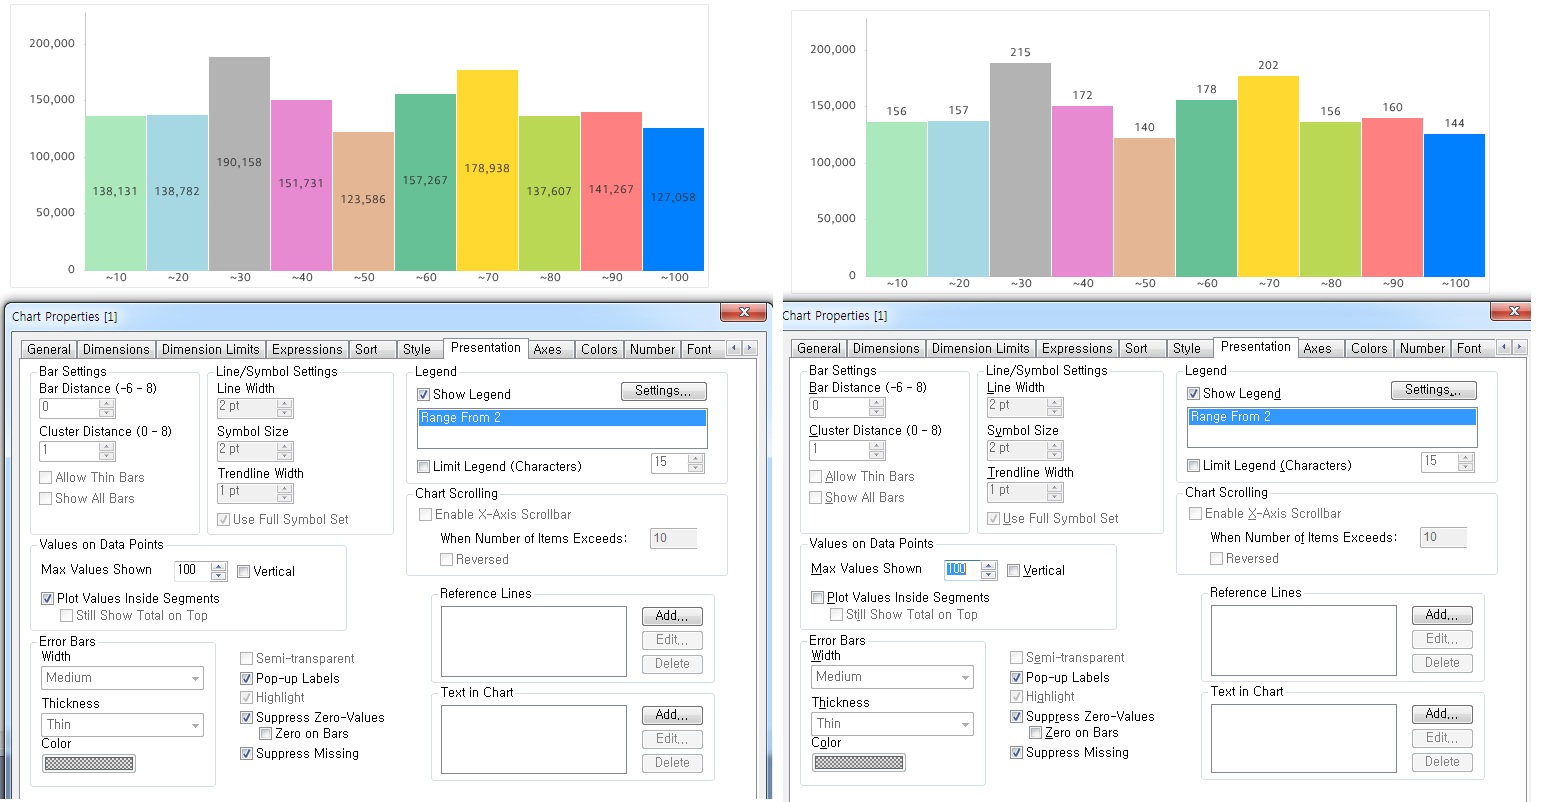
I made a Mekko chart and I'd like to show data on the chart, like right one as below image.
but the actual data is left one.
when I checked the "Plot Values Inside Segments", data is changed left to right.
Can someone help me?
Regards,
Sunju Lee.
Accepted Solutions
- Mark as New
- Bookmark
- Subscribe
- Mute
- Subscribe to RSS Feed
- Permalink
- Report Inappropriate Content
This is an issue with ver. 11 - when values are plotted inside segments, the automatic scale settings that you define in the Number tab, are not being used, and the whole number is presented instead.
Based on a recent blog by Rob Wunderlich, this problem is fixed in ver. 12. So, if you wait a little bit and upgrade to ver. 12, the problem will go away.
Until then, the only thing you can think of is a work around - for example, manually divide the number by 1000 and format the Axis accordingly.
cheers,
Oleg Troyansky
- Mark as New
- Bookmark
- Subscribe
- Mute
- Subscribe to RSS Feed
- Permalink
- Report Inappropriate Content
Oleg, thank you so much. it's really helpful.