Unlock a world of possibilities! Login now and discover the exclusive benefits awaiting you.
- Qlik Community
- :
- Forums
- :
- Analytics
- :
- New to Qlik Analytics
- :
- Re: Importing of txt files
- Subscribe to RSS Feed
- Mark Topic as New
- Mark Topic as Read
- Float this Topic for Current User
- Bookmark
- Subscribe
- Mute
- Printer Friendly Page
- Mark as New
- Bookmark
- Subscribe
- Mute
- Subscribe to RSS Feed
- Permalink
- Report Inappropriate Content
Importing of txt files
Hello, I am new to qliksense and trying to learn it. I have a dataset (txt file), have imported it yet. And when I open the datamanager its showed like a table, but the problem is in the visualization of the data. As dimension it shows the dates that right but when I try to add KPI there is only the range from -1 to 1. But there are huge numbers in the txt file, I think qliksense doesn't recognise these numbers. Thanks in advance.


- « Previous Replies
-
- 1
- 2
- Next Replies »
- Mark as New
- Bookmark
- Subscribe
- Mute
- Subscribe to RSS Feed
- Permalink
- Report Inappropriate Content
That works fine for me. I think you might have to post your whole app?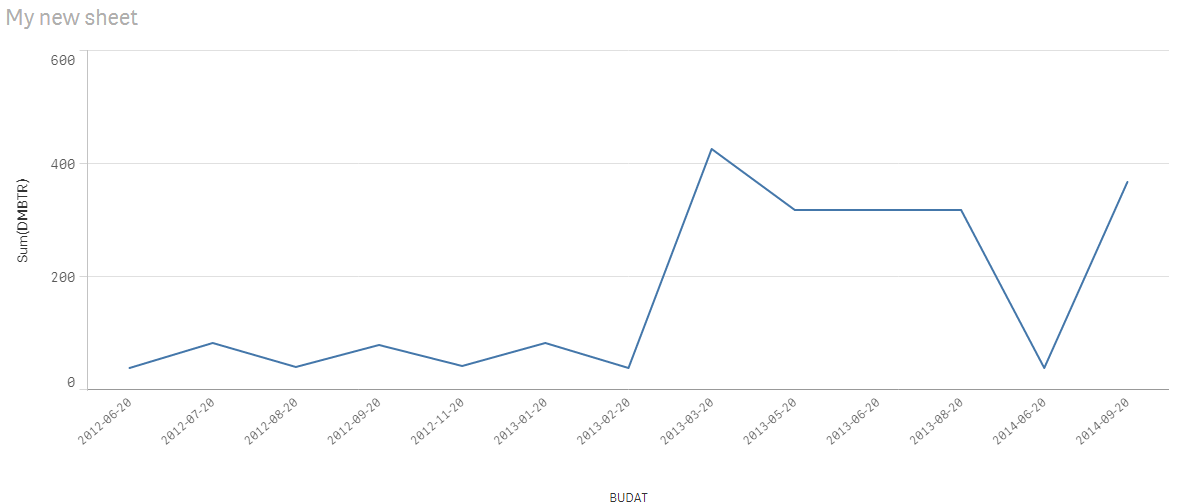
- Mark as New
- Bookmark
- Subscribe
- Mute
- Subscribe to RSS Feed
- Permalink
- Report Inappropriate Content
It worked -_- , I just needed the sum had a Logical error. Because there are more values for one date the data couldn't be simulated. Thanks a lot 😃
- Mark as New
- Bookmark
- Subscribe
- Mute
- Subscribe to RSS Feed
- Permalink
- Report Inappropriate Content
They are the same things, just different names;
- KPI = Measure = Key Figure (all depends on vendor's labelling).
In Qlik Sense the visualisation will tell you what you need; for examle, One Dimension and One Measure. Your measure (KPI) will be whatever you want it to be, but remember you need to aggregate the measure.
For example you might have;
[Customer Number]
[Invoice Number]
[Value]
From these two things you can define all sorts of measures (KPIs);
Total Value per Customer = Sum([Value])
Number of Customers = Count(Distinct([Customer Number]))
Average Invoice Value = Sum([Value])/Count(Distinct([Invoice Number]))
So the measures (KPIs) come after the data load, depending on the business requirements.
- « Previous Replies
-
- 1
- 2
- Next Replies »