Unlock a world of possibilities! Login now and discover the exclusive benefits awaiting you.
- Qlik Community
- :
- All Forums
- :
- QlikView App Dev
- :
- Re: Aggregation of diagram data by clicking a butt...
- Subscribe to RSS Feed
- Mark Topic as New
- Mark Topic as Read
- Float this Topic for Current User
- Bookmark
- Subscribe
- Mute
- Printer Friendly Page
- Mark as New
- Bookmark
- Subscribe
- Mute
- Subscribe to RSS Feed
- Permalink
- Report Inappropriate Content
Aggregation of diagram data by clicking a button?
Hello,
so i created a diagram with 3 dimensions.
I am currently happy with the results. Short explanation about the contents you see in the screenshot:
It is a bar diagram about all people visiting a place througout given years with gender F/M. (you can ignore the third dimension)
Now what i would like to have for this diagram. I would like to add 2 buttons (they basically do the same):
If i press the "aggregate gender" button. The split columns of (F/M) should sum up and only show the total amount per year.
The second button would be similar - would be an "aggregate year" button. If i press this button, all the years would fall together, so that i would only have 2 columns - F/M - with the total amount of visits for all years.
Is this possible? If so, how?
Would appreciate any help.
Accepted Solutions
- Mark as New
- Bookmark
- Subscribe
- Mute
- Subscribe to RSS Feed
- Permalink
- Report Inappropriate Content
Hi Daniel, one option is to use a variable for each button and conditional dimensions.
In example the button to aggregate F/M can change vSplitGender between 1 and 0 and you can use this variable in conditional dimension:
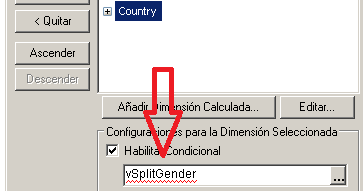
When the variable is 0, the dimension should disappear.
Before applying you can set the conditional to 0, this way you can check if the expected results will work for you.
- Mark as New
- Bookmark
- Subscribe
- Mute
- Subscribe to RSS Feed
- Permalink
- Report Inappropriate Content
Hi Daniel, one option is to use a variable for each button and conditional dimensions.
In example the button to aggregate F/M can change vSplitGender between 1 and 0 and you can use this variable in conditional dimension:
When the variable is 0, the dimension should disappear.
Before applying you can set the conditional to 0, this way you can check if the expected results will work for you.
- Mark as New
- Bookmark
- Subscribe
- Mute
- Subscribe to RSS Feed
- Permalink
- Report Inappropriate Content
Hi Ruben,
thanks a lot. I was not that familar with variables in QV yet - so great advice! Works fine!
So now with my button, i can change the value of the given variable to 1 or 0.
Is it possible to change it to 1 if the variable is 0 and to 1 if the variable is 0 with the same button?
I entered this "experimental" code into the value field of the button (instead of 1 or 0).
if(vSplitGender=0,vSplitGender=1,vSplitGender=0)
Unfortunately does not work but i hope you get what i tried to achieve.
It would be easy to solve it with two buttons, but is there a way to solve it with 1 button?
- Mark as New
- Bookmark
- Subscribe
- Mute
- Subscribe to RSS Feed
- Permalink
- Report Inappropriate Content
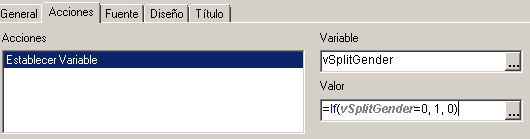
Yes, It's possible, in the button porperties go to 'Actions' tab.
Press 'Add Action'-->External-->Set variable
In the upper text box set the varibale name:vSplitGender
In the lower lower text box this expression: if(vSplitGender=0,1,0)
I don't have a QV avaliable so I'm talking using my memory, maybe something is called different.
- Mark as New
- Bookmark
- Subscribe
- Mute
- Subscribe to RSS Feed
- Permalink
- Report Inappropriate Content
Hello Ruben,
ok this one is pretty similar to what i tried out before. Unforunately it does not work yet as you described.
But anyways! You pretty much gave me the solution to the much more important question i had before! So thank you - i guess i will find a solution for the second part with a bit of trial and error! So once again, thank you for your help!
- Mark as New
- Bookmark
- Subscribe
- Mute
- Subscribe to RSS Feed
- Permalink
- Report Inappropriate Content
Hi Daniel, wich part doesn't work? the variable values or the final chart?
For the variable value I forgot to add the intial '=':
For the second part, you can consider to remove the 3rd expression (wich I think is the blue-red stacked bars) to 2 expressions, using set analysis to filter each expression by the actual dimension values. This way you have two dimensions and 2 expressions, this allow you to set the 'Stacked' style and will return two columns, one for each gender, and stacked expressions.
- Mark as New
- Bookmark
- Subscribe
- Mute
- Subscribe to RSS Feed
- Permalink
- Report Inappropriate Content
Hello Ruben,
it works now as suggested by you. Thanks a lot for your input. I will have to try out your second suggeston (removing the third expression). Thanks for the idea!