Unlock a world of possibilities! Login now and discover the exclusive benefits awaiting you.
- Qlik Community
- :
- Forums
- :
- Analytics
- :
- New to Qlik Analytics
- :
- Re: colore diverso per spezzata lineare
- Subscribe to RSS Feed
- Mark Topic as New
- Mark Topic as Read
- Float this Topic for Current User
- Bookmark
- Subscribe
- Mute
- Printer Friendly Page
- Mark as New
- Bookmark
- Subscribe
- Mute
- Subscribe to RSS Feed
- Permalink
- Report Inappropriate Content
colore diverso per spezzata lineare
buon giorno, ho la stessa serie di dati riportata due volte come misura di un grafico lineare, ovvero ho due spezzate, una per l'anno 2014 e l'altro per il 2015. Come faccio ad attribuigli un colore specifico e fisso per spezzata?
Grazie
- Mark as New
- Bookmark
- Subscribe
- Mute
- Subscribe to RSS Feed
- Permalink
- Report Inappropriate Content
"Good morning , I have the same set of data reported twice as a measure of a line graph, or I have two broken , one for 2014 and one for 2015. How do I attribuigli a specific color and fixed broken ? Thank you"
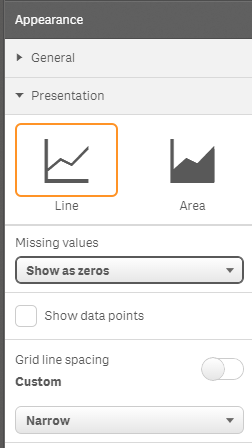
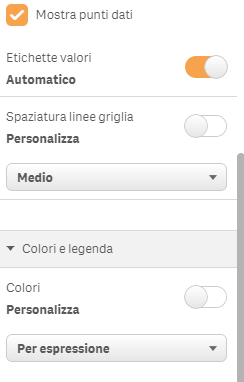
To assign specific color to your dimension go to Colors and dimensions and set it to color by dimension
To remove gaps set missing values to show as zeros
Regards
Andy
- Mark as New
- Bookmark
- Subscribe
- Mute
- Subscribe to RSS Feed
- Permalink
- Report Inappropriate Content
sorry, but I do not see how I can associate a color to an extent.
I was trying with color expression but I do not work
- Mark as New
- Bookmark
- Subscribe
- Mute
- Subscribe to RSS Feed
- Permalink
- Report Inappropriate Content
extent = measure
- Mark as New
- Bookmark
- Subscribe
- Mute
- Subscribe to RSS Feed
- Permalink
- Report Inappropriate Content
Unfortunately at the moment you cannot assign a colour to a particular measure just at dimension level.
- Mark as New
- Bookmark
- Subscribe
- Mute
- Subscribe to RSS Feed
- Permalink
- Report Inappropriate Content
- Mark as New
- Bookmark
- Subscribe
- Mute
- Subscribe to RSS Feed
- Permalink
- Report Inappropriate Content
Hi Andrea
Yes you can in a bar chart by going to Add ons > reference lines and defining your trend criteria
Regards
Andy