Unlock a world of possibilities! Login now and discover the exclusive benefits awaiting you.
- Qlik Community
- :
- All Forums
- :
- QlikView App Dev
- :
- Re: Counting the records in a period and plotting ...
- Subscribe to RSS Feed
- Mark Topic as New
- Mark Topic as Read
- Float this Topic for Current User
- Bookmark
- Subscribe
- Mute
- Printer Friendly Page
- Mark as New
- Bookmark
- Subscribe
- Mute
- Subscribe to RSS Feed
- Permalink
- Report Inappropriate Content
Counting the records in a period and plotting them on a line graph
Hi Community!
I have a set of data and each record has a creation date.
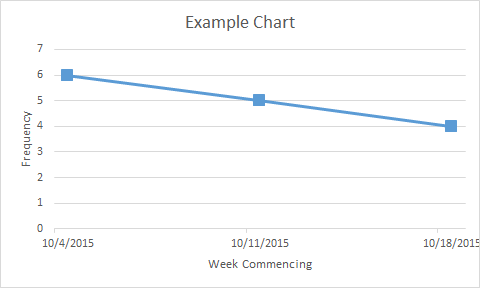
I want to plot a line chart which shows the number of records that have been created in either a weekly or a monthly period
I want to show the weeks/ Months across the x axis and the frequency on the y axis.
e.g.
| ID | Color | Creation Date |
| 1001 | Red | 10/21/2015 |
| 1002 | Blue | 10/20/2015 |
| 1003 | Blue | 10/20/2015 |
| 1004 | Yellow | 10/19/2015 |
| 1005 | Red | 10/16/2015 |
| 1006 | Blue | 10/15/2015 |
| 1007 | Blue | 10/12/2015 |
| 1008 | Yellow | 10/11/2015 |
| 1009 | Red | 10/11/2015 |
| 1010 | Blue | 10/8/2015 |
| 1011 | Blue | 10/8/2015 |
| 1012 | Blue | 10/7/2015 |
| 1013 | Red | 10/6/2015 |
| 1014 | Yellow | 10/5/2015 |
| 1015 | Red | 10/5/2015 |
What expression would I use for the Dimension and then would I need to do anything special to the Expressions to enable them to show in the correct period?
Is manipulation of the data in the script required or is there an easy way to do this?
Thanks
Accepted Solutions
- Mark as New
- Bookmark
- Subscribe
- Mute
- Subscribe to RSS Feed
- Permalink
- Report Inappropriate Content
- Mark as New
- Bookmark
- Subscribe
- Mute
- Subscribe to RSS Feed
- Permalink
- Report Inappropriate Content
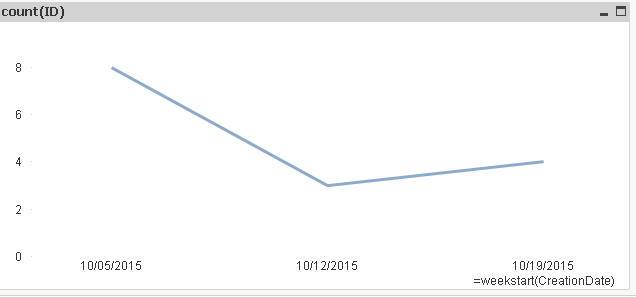
dimension weekstart([Creation Date])
expression count(ID)
- Mark as New
- Bookmark
- Subscribe
- Mute
- Subscribe to RSS Feed
- Permalink
- Report Inappropriate Content
Hi,
for large tables you could calculate the periods in the script for performance reasons like this:
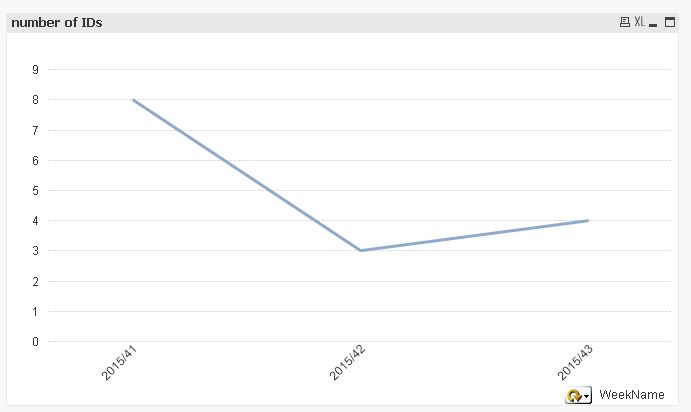
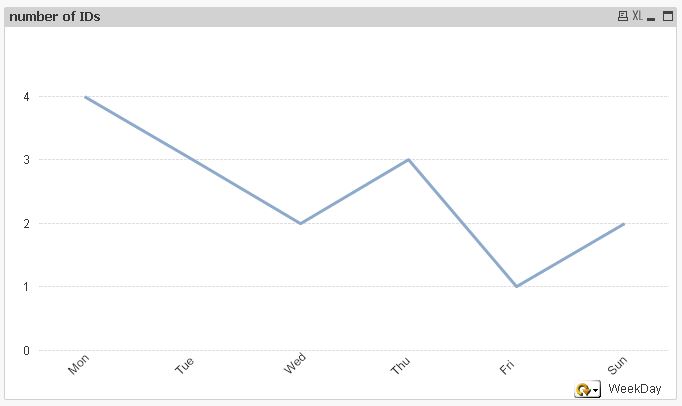
table1:
LOAD * FROM [https://community.qlik.com/thread/188494] (html, codepage is 1252, embedded labels, table is @1);

tabCalendar:
LOAD *,
    Day([Creation Date]) as Day,
    WeekDay([Creation Date]) as WeekDay,
    Week([Creation Date]) as Week,
    WeekName([Creation Date]) as WeekName,
    Month([Creation Date]) as Month,
    MonthName([Creation Date]) as MonthName,
    Dual('Q'&Ceil(Month([Creation Date])/3),Ceil(Month([Creation Date])/3)) as Quarter,
    QuarterName([Creation Date]) as QuarterName,
    Year([Creation Date]) as Year,
    WeekYear([Creation Date]) as WeekYear;
LOAD Date(MinDate+IterNo()-1) as [Creation Date]
While MinDate+IterNo()-1 <= MaxDate;
LOAD Min([Creation Date]) as MinDate,
    Max([Creation Date]) as MaxDate
Resident table1;
hope this helps
regards
Marco
- Mark as New
- Bookmark
- Subscribe
- Mute
- Subscribe to RSS Feed
- Permalink
- Report Inappropriate Content
This worked perfectly, thanks for the quick response
- Mark as New
- Bookmark
- Subscribe
- Mute
- Subscribe to RSS Feed
- Permalink
- Report Inappropriate Content
I might look into doing it this way if the data set grows to be very large.
Thanks!