Unlock a world of possibilities! Login now and discover the exclusive benefits awaiting you.
- Qlik Community
- :
- All Forums
- :
- QlikView App Dev
- :
- Grouping Dimension Values for a Funnel Diagramm
Options
- Subscribe to RSS Feed
- Mark Topic as New
- Mark Topic as Read
- Float this Topic for Current User
- Bookmark
- Subscribe
- Mute
- Printer Friendly Page
Turn on suggestions
Auto-suggest helps you quickly narrow down your search results by suggesting possible matches as you type.
Showing results for
Not applicable
2015-10-27
07:48 AM
- Mark as New
- Bookmark
- Subscribe
- Mute
- Subscribe to RSS Feed
- Permalink
- Report Inappropriate Content
Grouping Dimension Values for a Funnel Diagramm
Hi,
I want to create a funnel diagramm to show how deep visitors are digging into the content of the page. The data looks somehow like this:
| Pages | Hits |
|---|---|
| www.abc.com/a/slide1.html | 100 |
www.abc.com/a/slide2.html | 90 |
| www.abc.com/a/slide3.html | 80 |
| www.abc.com/b/slide1.html | 100 |
| www.abc.com/b/slide2.html | 90 |
| www.abc.com/b/slide3.html | 80 |
| www.abc.com/c/slide1.html | 100 |
| www.abc.com/c/slide2.html | 90 |
| www.abc.com/c/slide3.html | 80 |
The funnel should only report on slides, so:
Slide1 : 300
Slide2 : 270
Slide3 : 240
I first tried it with a dynamic dimension e.g.:
=If(SubStringCount(Pages, 'slide1')> 0, Pages)
But this is not giving me the results i wanted as this would have three results for Slide1 (www.abc.com/a,www.abc.com/b,www.abc.com/c)
Do you have any ideas how to visualize that?
292 Views
1 Reply
Master III
2015-10-28
09:33 AM
- Mark as New
- Bookmark
- Subscribe
- Mute
- Subscribe to RSS Feed
- Permalink
- Report Inappropriate Content
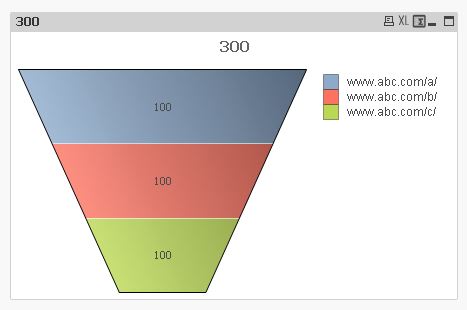
Hi,
May be like this...
228 Views