Unlock a world of possibilities! Login now and discover the exclusive benefits awaiting you.
- Qlik Community
- :
- All Forums
- :
- QlikView App Dev
- :
- Restrict data in chart and table
- Subscribe to RSS Feed
- Mark Topic as New
- Mark Topic as Read
- Float this Topic for Current User
- Bookmark
- Subscribe
- Mute
- Printer Friendly Page
- Mark as New
- Bookmark
- Subscribe
- Mute
- Subscribe to RSS Feed
- Permalink
- Report Inappropriate Content
Restrict data in chart and table
I am bringing in 1 table. I have two tab in the application. One needs to show group A data and the other group B data.
In one tab I have a chart listing column 1, 2, and 3 and the chart has an expression "IF group A" . The tab also has a table listing and currently it shows all A and B. I want it to show only group A like the chart.
The other tab has same as above but for group B.
- Tags:
- qlikview_scripting
- Mark as New
- Bookmark
- Subscribe
- Mute
- Subscribe to RSS Feed
- Permalink
- Report Inappropriate Content
Hi,
You can try to create one Button / On Activate Sheet Trigger
Like
Select In Field -> Your Field (you already used for your chart ,"if Group A") ->
Search String (Entered your Filter Expression)
Then you will get the same data for your chart and Table
- Mark as New
- Bookmark
- Subscribe
- Mute
- Subscribe to RSS Feed
- Permalink
- Report Inappropriate Content
I didn't get the exact requirement, if you need to reduce the data then make you of the conditional statements according to your requirement , this should resolve the issue.
Please try to share the data or sample file so that it will be helpful for us to understand
- Mark as New
- Bookmark
- Subscribe
- Mute
- Subscribe to RSS Feed
- Permalink
- Report Inappropriate Content
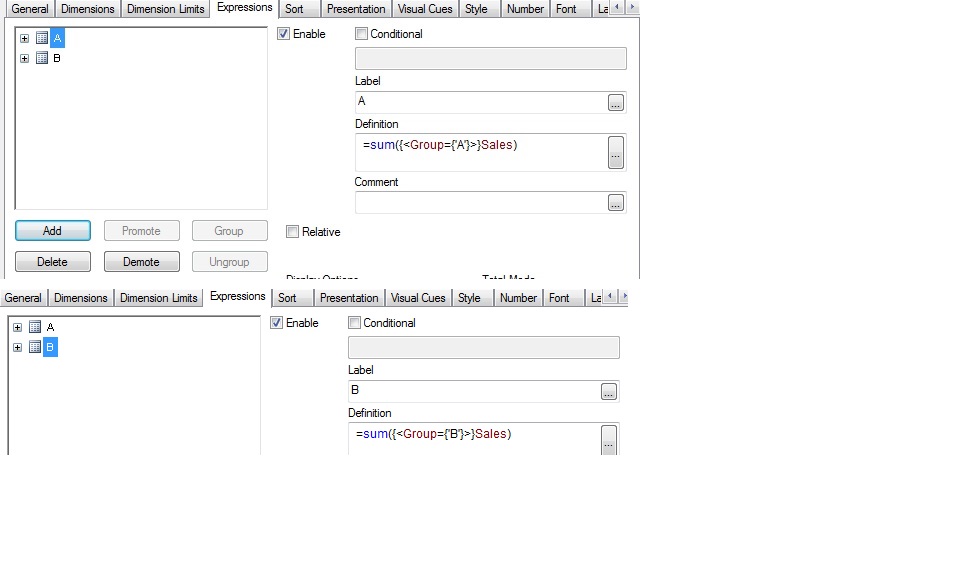
The charts in the respective tabs should include the group condition in set expressions:
Sum({<group = {A}>} Amount) for the chart on tab A
Sum({<group = {B}>} Amount) for the chart on tab B
Although I am not sure that this is the best design. If the charts and structure of the two groups is the same, why not just provide a list box for group and let the user choose the group? If necessary, hide or conditionally calculate the objects using the condition "GetSelectedCount(group) = 1" or something similar.
- Mark as New
- Bookmark
- Subscribe
- Mute
- Subscribe to RSS Feed
- Permalink
- Report Inappropriate Content
Hi,
What I can understand from your statement is you have data something like this:
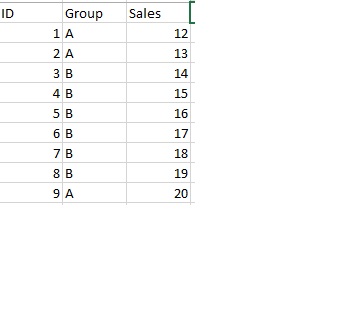
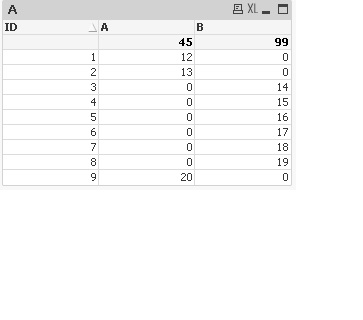
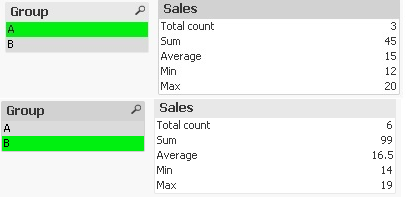
Regards,
Neha
- Mark as New
- Bookmark
- Subscribe
- Mute
- Subscribe to RSS Feed
- Permalink
- Report Inappropriate Content
hi
So you want to reduce the data, for that you can use alternative state. in tab1 you can use state1 fro chart1 and in tab2 state2 for same chart u can use.
- Mark as New
- Bookmark
- Subscribe
- Mute
- Subscribe to RSS Feed
- Permalink
- Report Inappropriate Content
hi
So you want to reduce the data, for that you can use alternative state. in tab1 you can use state1 fro chart1 and in tab2 state2 for same chart u can use.
- Mark as New
- Bookmark
- Subscribe
- Mute
- Subscribe to RSS Feed
- Permalink
- Report Inappropriate Content
These are all good. This is what I have
Country Sales
A 6000
A 1500
B 2000
B 2500
B 9000
C 1500
In one tab,
I have a chart with the expression =if([Country] = 'A' or [Country] = 'C',Country)
This displays:
Country Sales
A 7500
C 1500
The data chart shows ALL (A, B, C) because I don't know how to limit the data to only A and C.
I tried using the sheet property Select In Field, but with this I can only have 1 value and I have 2 (A and C).
- Mark as New
- Bookmark
- Subscribe
- Mute
- Subscribe to RSS Feed
- Permalink
- Report Inappropriate Content
Hi,
Try to give your 2 values in search string..
Select in Field -> search string
('A'|'C')
- Mark as New
- Bookmark
- Subscribe
- Mute
- Subscribe to RSS Feed
- Permalink
- Report Inappropriate Content
I was able to add more than 1 value using the Select in Field --> Search String (A|C) . This worked.