Unlock a world of possibilities! Login now and discover the exclusive benefits awaiting you.
- Qlik Community
- :
- All Forums
- :
- QlikView App Dev
- :
- Re: Last row as total
- Subscribe to RSS Feed
- Mark Topic as New
- Mark Topic as Read
- Float this Topic for Current User
- Bookmark
- Subscribe
- Mute
- Printer Friendly Page
- Mark as New
- Bookmark
- Subscribe
- Mute
- Subscribe to RSS Feed
- Permalink
- Report Inappropriate Content
Last row as total
Hi,
how can i display the last row in a straight table as total?
Example:
| Date | 50 |
|---|---|
11-01-2015 | 4 |
| 11-02-2015 | 10 |
| 11-03-2015 | 90 |
| 11-04-2015 | 2 |
| 11-05-2015 | 50 |
Greetings
Phil
- « Previous Replies
-
- 1
- 2
- Next Replies »
- Mark as New
- Bookmark
- Subscribe
- Mute
- Subscribe to RSS Feed
- Permalink
- Report Inappropriate Content
Hi,
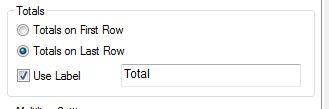
Within the chart properties > Presentation you have the totals section.
Mark
- Mark as New
- Bookmark
- Subscribe
- Mute
- Subscribe to RSS Feed
- Permalink
- Report Inappropriate Content
Hi Mark,
thx for your reply. But thats not what i want.
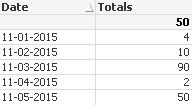
The Row for Totals should be on the first Row. But the value that is displayed there, should be the value of the last row in the table. Like in my example.
- Mark as New
- Bookmark
- Subscribe
- Mute
- Subscribe to RSS Feed
- Permalink
- Report Inappropriate Content
Find this attached file:
- Mark as New
- Bookmark
- Subscribe
- Mute
- Subscribe to RSS Feed
- Permalink
- Report Inappropriate Content
Hi Braga,
![2015-11-11 11_35_01-QlikView x64 - [C__Users_wn00055411_Downloads_Community.qvw_].png](/legacyfs/online/105139_2015-11-11 11_35_01-QlikView x64 - [C__Users_wn00055411_Downloads_Community.qvw_].png)
It shows 156 as total in your Example. But instead it should show 50, because thats the "newest" value in respect of date....
- Mark as New
- Bookmark
- Subscribe
- Mute
- Subscribe to RSS Feed
- Permalink
- Report Inappropriate Content
This?
- Mark as New
- Bookmark
- Subscribe
- Mute
- Subscribe to RSS Feed
- Permalink
- Report Inappropriate Content
See my answer above  . It is the solution for your problem in a simple and clean way
- Mark as New
- Bookmark
- Subscribe
- Mute
- Subscribe to RSS Feed
- Permalink
- Report Inappropriate Content
May be try this expression (using Braga's complied QVW file)
=FirstSortedValue(Aggr(Sum("50"), Date), -Date)
- Mark as New
- Bookmark
- Subscribe
- Mute
- Subscribe to RSS Feed
- Permalink
- Report Inappropriate Content
Sorry, this isnt working for me because i cant calculate these fields in script.
There is an expression for this column. If you select 11-01-2015 to 11-13-2015 then it should show the value of 11-13-2015 als total. If you select 05-01-2015 to 05-24-2015 then it should show the value of 05-24-2015 as total.
- Mark as New
- Bookmark
- Subscribe
- Mute
- Subscribe to RSS Feed
- Permalink
- Report Inappropriate Content
Have you looked at the FirstSortedValue solution provided below?
- « Previous Replies
-
- 1
- 2
- Next Replies »