Unlock a world of possibilities! Login now and discover the exclusive benefits awaiting you.
- Qlik Community
- :
- All Forums
- :
- QlikView App Dev
- :
- Re: Formular sorting one number
- Subscribe to RSS Feed
- Mark Topic as New
- Mark Topic as Read
- Float this Topic for Current User
- Bookmark
- Subscribe
- Mute
- Printer Friendly Page
- Mark as New
- Bookmark
- Subscribe
- Mute
- Subscribe to RSS Feed
- Permalink
- Report Inappropriate Content
Formular sorting one number
hey @ all,
i am having a problem with a diagram and the values which shoud be shorted for this diagramm.
The Problem:
I had to make some diagrams from some orderings but the order is the last two numbers from a value in this number.
For example:
Ordernumber1: 100458500030
Ordernumber2: 100898500080
My testing idea was to that there is a condition using the formula like =if(OperationId=(*30),OperationId) but the *30 isn't working.
For this diagram i want to sort after 30 and 80.
All with 30 at the end in one diagramm and all 80 in the the other one.
I didn't find any way to make this working.
And my desire is that i can generate diagrams after every, i will say status(30,80), for this at runtime.
- « Previous Replies
-
- 1
- 2
- Next Replies »
Accepted Solutions
- Mark as New
- Bookmark
- Subscribe
- Mute
- Subscribe to RSS Feed
- Permalink
- Report Inappropriate Content
I don't know what you mean by 'Diagram' either but if you want to use that 2 last digits as a dimension you may create it as a field:
LOAD ....
Right(OperationId, 2) as StepNumber
To show only by department (without empy 'diagrams') depends of the kind of chart you're using and how distributes the information, maybe you find that issue or maybe it directly works as you want.
- Mark as New
- Bookmark
- Subscribe
- Mute
- Subscribe to RSS Feed
- Permalink
- Report Inappropriate Content
Hi Tim, I'm not sure to understand the problem but about your 'If' testing, you can try with:
=if(Right(OperationId, 2)='30',OperationId)
- Mark as New
- Bookmark
- Subscribe
- Mute
- Subscribe to RSS Feed
- Permalink
- Report Inappropriate Content
please post some more sample data and your exprected result.
regards
Marco
- Mark as New
- Bookmark
- Subscribe
- Mute
- Subscribe to RSS Feed
- Permalink
- Report Inappropriate Content
@Ruben Marin:
Thx for your request this was the right formula. My solution for the first step now is:
sum(if(Right(OperationId, 2)='30',yield.primary))
yield.primary = the pices per Order
The second problem with more sample data and information:
OrderIDs: department:
Ordernumber1: 100458500030 IT
Ordernumber2: 100898500080 IT
Ordernumber3: 100834300080 production
Ordernumber4: 100789500010 production
Ordernumber5: 100321500050 production
In the table above you can see that there are two orders for IT with two different last numbers: 30 and 80
And for prodction there are 3: 10, 50 and 80
My idea is that i can create diagramms dynamic for each department and the last numbers.
For example: Cost center one hast 2 steps for making a product and cost center two has 3.
If the user is looking at a cost center he wants to see the data for every step but the problem is that there are different steps(numbers) and different numbers in steps.
My question is how can i solve this that qlikview shows two diagramms for IT (30,80) and for production 3 (80,10,50) without looking at 3 diagramms(one empty) in IT.
I hope you can understand my idea.
Thx for all your comments.
Tim
- Mark as New
- Bookmark
- Subscribe
- Mute
- Subscribe to RSS Feed
- Permalink
- Report Inappropriate Content
You are missing Like operator with wildmatch string , try this:
=if(OperationId like '*30',OperationId) //will work for sure
Also check the Suppress null values
- Mark as New
- Bookmark
- Subscribe
- Mute
- Subscribe to RSS Feed
- Permalink
- Report Inappropriate Content
Create the two flags in the script
=if(wildmatch(Ordernumber1,'*30',1) as OrderFlag_30,
if(wildmatch(Ordernumber1,'*80',1) as OrderFlag_80
Now you can use this Flag in your expression
{<OrderFlag_30={'1'}>}
- Mark as New
- Bookmark
- Subscribe
- Mute
- Subscribe to RSS Feed
- Permalink
- Report Inappropriate Content
what do you mean by Diagram? Can you draw one Diagram for us?
- Mark as New
- Bookmark
- Subscribe
- Mute
- Subscribe to RSS Feed
- Permalink
- Report Inappropriate Content
I don't know what you mean by 'Diagram' either but if you want to use that 2 last digits as a dimension you may create it as a field:
LOAD ....
Right(OperationId, 2) as StepNumber
To show only by department (without empy 'diagrams') depends of the kind of chart you're using and how distributes the information, maybe you find that issue or maybe it directly works as you want.
- Mark as New
- Bookmark
- Subscribe
- Mute
- Subscribe to RSS Feed
- Permalink
- Report Inappropriate Content
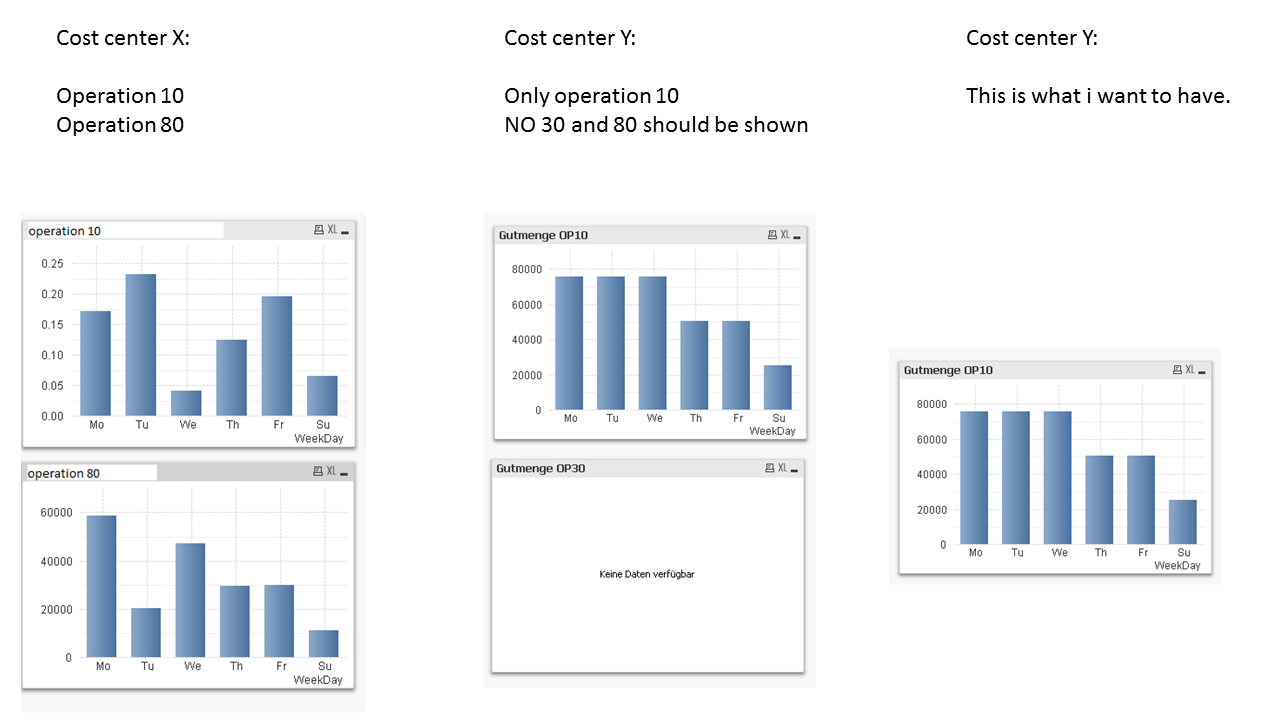
This is a sample i made.
Every of this chart should be on the same page.
The left one is cost center X with two operations. op 10 and op 80 should be shown.
The middle is how it looks now. A diagramm with no data in op 30 for cost center Y.
But i only want to look at the right side with the op 10 shown on the page for this costcenter.
- Mark as New
- Bookmark
- Subscribe
- Mute
- Subscribe to RSS Feed
- Permalink
- Report Inappropriate Content
If you create one field to store the operation (or StepNumber) you can use this field as the conditional show of the chart, in the 'Design' tab check the 'Conditional' option and an expression similar to:
=Count({<StepNumber={'30'}, CostCenter={'Y'}>} StepNumber)
If the count is =0 (no records with StepNumber='30' for the CostCenter='Y') the chart will be hidden.
- « Previous Replies
-
- 1
- 2
- Next Replies »