Unlock a world of possibilities! Login now and discover the exclusive benefits awaiting you.
- Qlik Community
- :
- All Forums
- :
- QlikView Administration
- :
- Re: How to Create Custom Colors in Charts
- Subscribe to RSS Feed
- Mark Topic as New
- Mark Topic as Read
- Float this Topic for Current User
- Bookmark
- Subscribe
- Mute
- Printer Friendly Page
- Mark as New
- Bookmark
- Subscribe
- Mute
- Subscribe to RSS Feed
- Permalink
- Report Inappropriate Content
How to Create Custom Colors in Charts
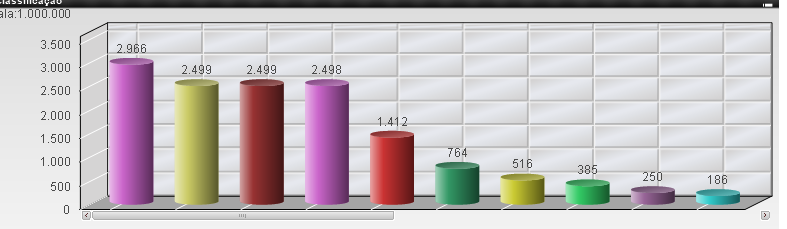
Good afternoon, I received a qvw with custom graphics beyond what is available natively on QlikView, does someone knows this
functionality?
Boa tarde, recebi um QVW com gráficos personalizados alem do que esta disponível nativamente no qlikview, alguém conhece essa
funcionalidade?
Note: Translation edited by moderator as a courtesy
Accepted Solutions
- Mark as New
- Bookmark
- Subscribe
- Mute
- Subscribe to RSS Feed
- Permalink
- Report Inappropriate Content
I think what you are seeing is an image in the chart background. You can set that at Colors, Frame Background, Image.
-Rob
- Mark as New
- Bookmark
- Subscribe
- Mute
- Subscribe to RSS Feed
- Permalink
- Report Inappropriate Content
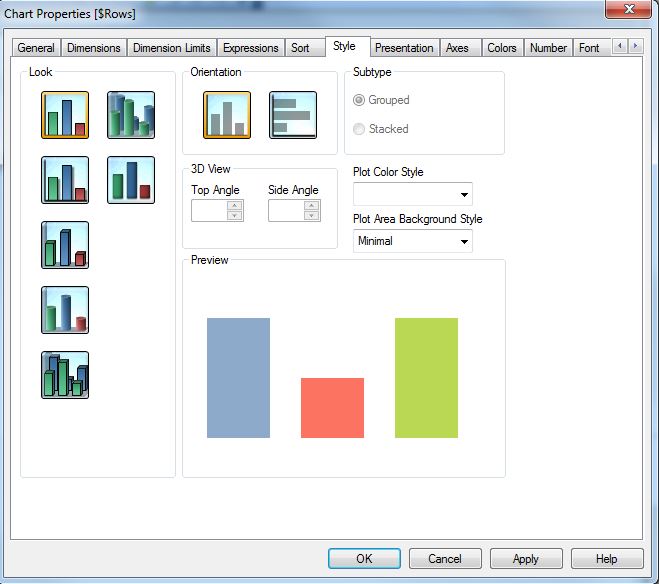
I think these types of charts can be created using the standard QlikView tools. In Chart Properties->Style, check your options.
Colors can be set to any RGB value you like in Chart Properties->Colors.
- Mark as New
- Bookmark
- Subscribe
- Mute
- Subscribe to RSS Feed
- Permalink
- Report Inappropriate Content
Hi,
Like Peter said, you can achieve very similar results with the normal QlikView options, you will find these on the style tab. You can then use a colour picker to pick out RGB codes if you want the specific colours.
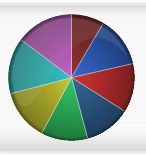
You may struggle a little with the back ground image on the bar chart (cylinder) and the white lines on the pie.
Mark
- Mark as New
- Bookmark
- Subscribe
- Mute
- Subscribe to RSS Feed
- Permalink
- Report Inappropriate Content
Nas propriedades do gráfico. você consegue colocar cores condicionais.
Abraço!
- Mark as New
- Bookmark
- Subscribe
- Mute
- Subscribe to RSS Feed
- Permalink
- Report Inappropriate Content
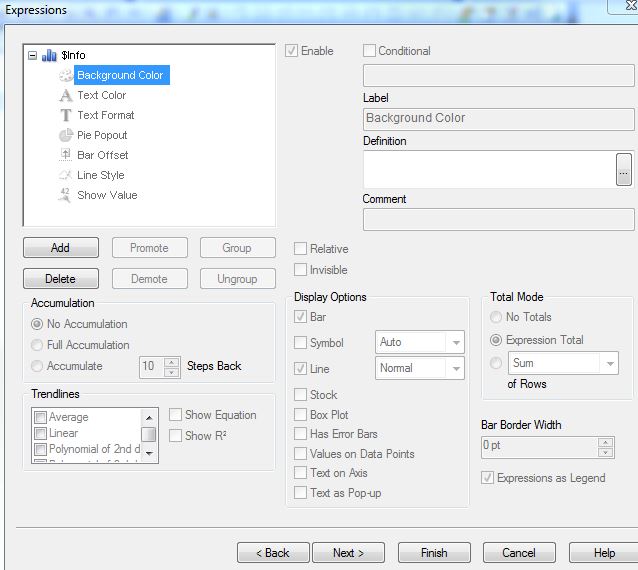
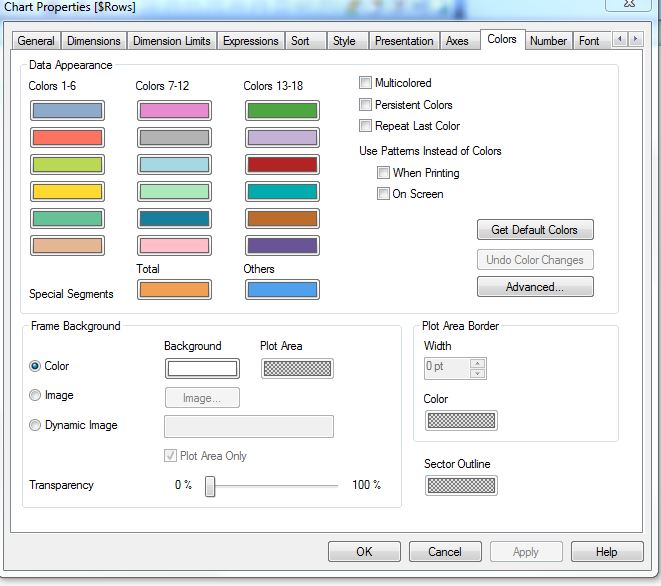
Click on get default colors or go to advanced to create own palette.You can hard code RGB on the expressions also.
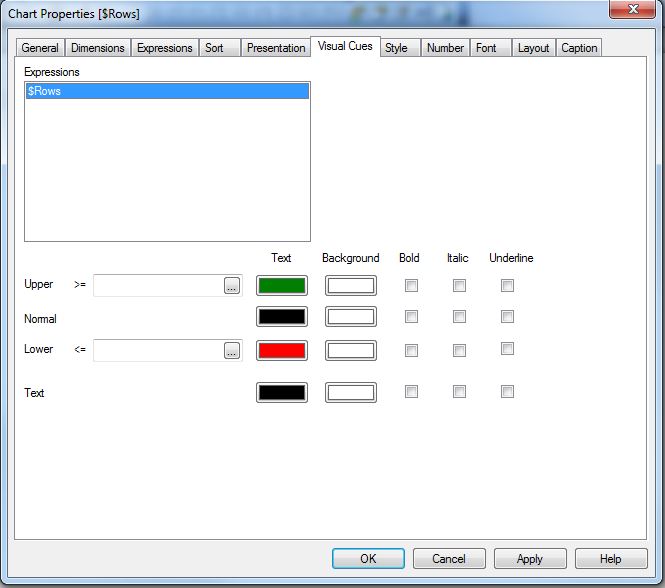
You can Visual Cues in QlikView objects like Straight table
- Mark as New
- Bookmark
- Subscribe
- Mute
- Subscribe to RSS Feed
- Permalink
- Report Inappropriate Content
I think what you are seeing is an image in the chart background. You can set that at Colors, Frame Background, Image.
-Rob