Unlock a world of possibilities! Login now and discover the exclusive benefits awaiting you.
- Qlik Community
- :
- Forums
- :
- Analytics
- :
- New to Qlik Analytics
- :
- Re: How to deal with Datetime , means how to retri...
- Subscribe to RSS Feed
- Mark Topic as New
- Mark Topic as Read
- Float this Topic for Current User
- Bookmark
- Subscribe
- Mute
- Printer Friendly Page
- Mark as New
- Bookmark
- Subscribe
- Mute
- Subscribe to RSS Feed
- Permalink
- Report Inappropriate Content
How to deal with Datetime , means how to retrieve dates times and days from Time series data. Please suggest me.
How to deal with Datetime , means how to retrieve dates times and days from Time series data. Please suggest me.
- « Previous Replies
-
- 1
- 2
- Next Replies »
- Mark as New
- Bookmark
- Subscribe
- Mute
- Subscribe to RSS Feed
- Permalink
- Report Inappropriate Content
You can use Date() function to retrieve date and Time() function to retrieve time. If that's not what you are looking for, would you be able to elaborate a little?
- Mark as New
- Bookmark
- Subscribe
- Mute
- Subscribe to RSS Feed
- Permalink
- Report Inappropriate Content
Hello,
Use Help. For example:
I suggest you use QlikView Help for functions (F1), if you have it installed.
Date(Floor(DATE)) --> You get the date.
etc.
BR
Serhan
- Mark as New
- Bookmark
- Subscribe
- Mute
- Subscribe to RSS Feed
- Permalink
- Report Inappropriate Content
Hi
I think you've got something like that as date field :
'DD MMMM YYYY hh:mm' called "date" in your data
So
To get the hour :
Hour(Timestamp("date_ID",'DD MMMM YYYY hh:mm')) as Hour_ID,
to get only the date :
Date(Floor(Date("date_ID",'DD MMMM YYYY hh:mm')),'DD/MM/YYYY')) as "date_ID",
week
Week(Floor(Date("date_ID",'DD MMMM YYYY hh:mm')),'DD/MM/YYYY')) as "week_ID",
month :
Month(Floor(Date("date_ID",'DD MMMM YYYY hh:mm')),'DD/MM/YYYY')) as "month_ID",
Bruno
- Mark as New
- Bookmark
- Subscribe
- Mute
- Subscribe to RSS Feed
- Permalink
- Report Inappropriate Content
Please be a bit more specific in your request. If possible, with a sample of the data you have, and the detail you'd like to retrieve. This way, we're only guessing.
KR,
Johan
- Mark as New
- Bookmark
- Subscribe
- Mute
- Subscribe to RSS Feed
- Permalink
- Report Inappropriate Content
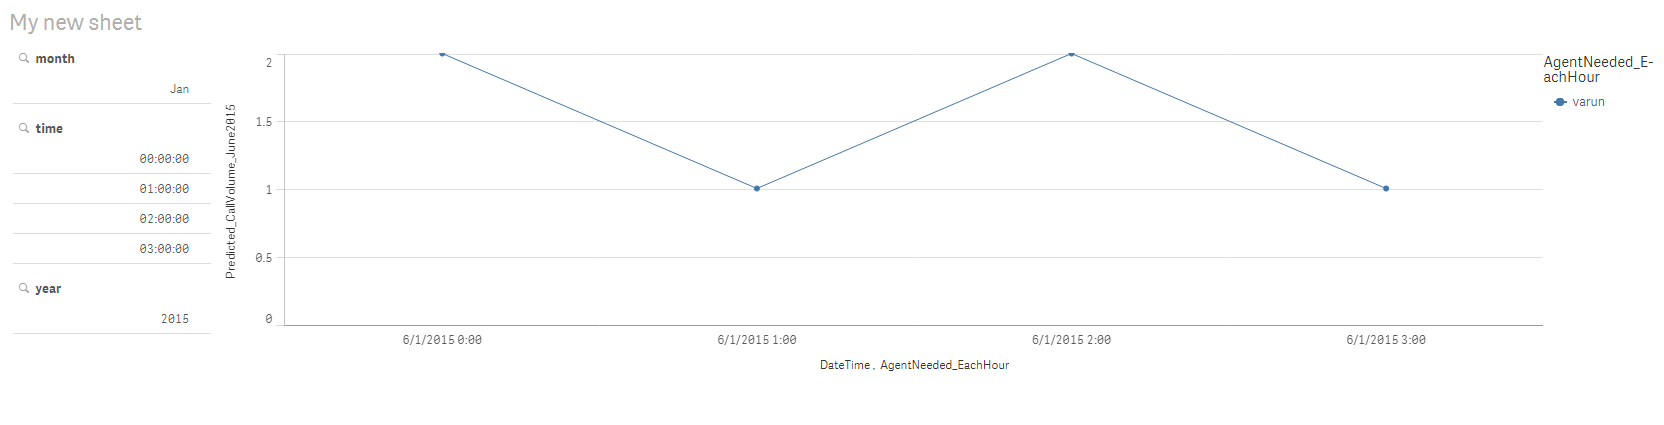
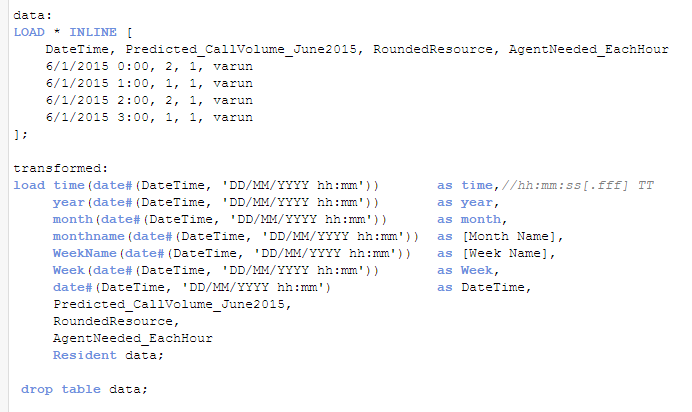
| DateTime | Predicted_CallVolume_June2015 | RoundedResource | AgentNeeded_EachHour |
| 6/1/2015 0:00 | 2 | 1 | varun |
| 6/1/2015 1:00 | 1 | 1 | varun |
| 6/1/2015 2:00 | 2 | 1 | varun |
| 6/1/2015 3:00 | 1 | 1 | varun |
I have a dataset with these sample columns . I want to add DateTime as X-axis and all columns as Y-axis.
How to add AgentNeeded_EachHour column as points on the same graph.
As well as I want to add filter for hours months and days.
Can it will be possible.
Thanks Friends .
Please suggest me.
- Mark as New
- Bookmark
- Subscribe
- Mute
- Subscribe to RSS Feed
- Permalink
- Report Inappropriate Content
Hi Bibhuti,
With the sample data you have given above, I have made a sample for you.
Used a bar chart to display the data and included all the other filter you requested for.
Please find the qvf attached
Hope this answers your questions!
- Sangram
- Mark as New
- Bookmark
- Subscribe
- Mute
- Subscribe to RSS Feed
- Permalink
- Report Inappropriate Content
Hi
To get hour and date
add this in your script
date(floor(Timestamp(DateTime,'DD MMMM YYYY hh:mm'))) as "Date",
Hour(Timestamp(DateTime,'DD MMMM YYYY hh:mm')) as "Hour",
you can add this also :
week(date(floor(Timestamp(DateTime,'DD MMMM YYYY hh:mm')))) as "Week",
Month(floor(Timestamp(DateTime,'DD MMMM YYYY hh:mm')))) as "Month",
this will add you 2 dimensions one for date , one for hours
See attached app as exemple with bar graph as call volume and line as needed agent to handled your call

Regards
Bruno
- Mark as New
- Bookmark
- Subscribe
- Mute
- Subscribe to RSS Feed
- Permalink
- Report Inappropriate Content
Thanks Bro,
I will apply this script,
Thanks again bro...

- Mark as New
- Bookmark
- Subscribe
- Mute
- Subscribe to RSS Feed
- Permalink
- Report Inappropriate Content
Thanks Mr Bertels,
This helps me alot.
Thanks & Regards,
Bibhuti
- « Previous Replies
-
- 1
- 2
- Next Replies »